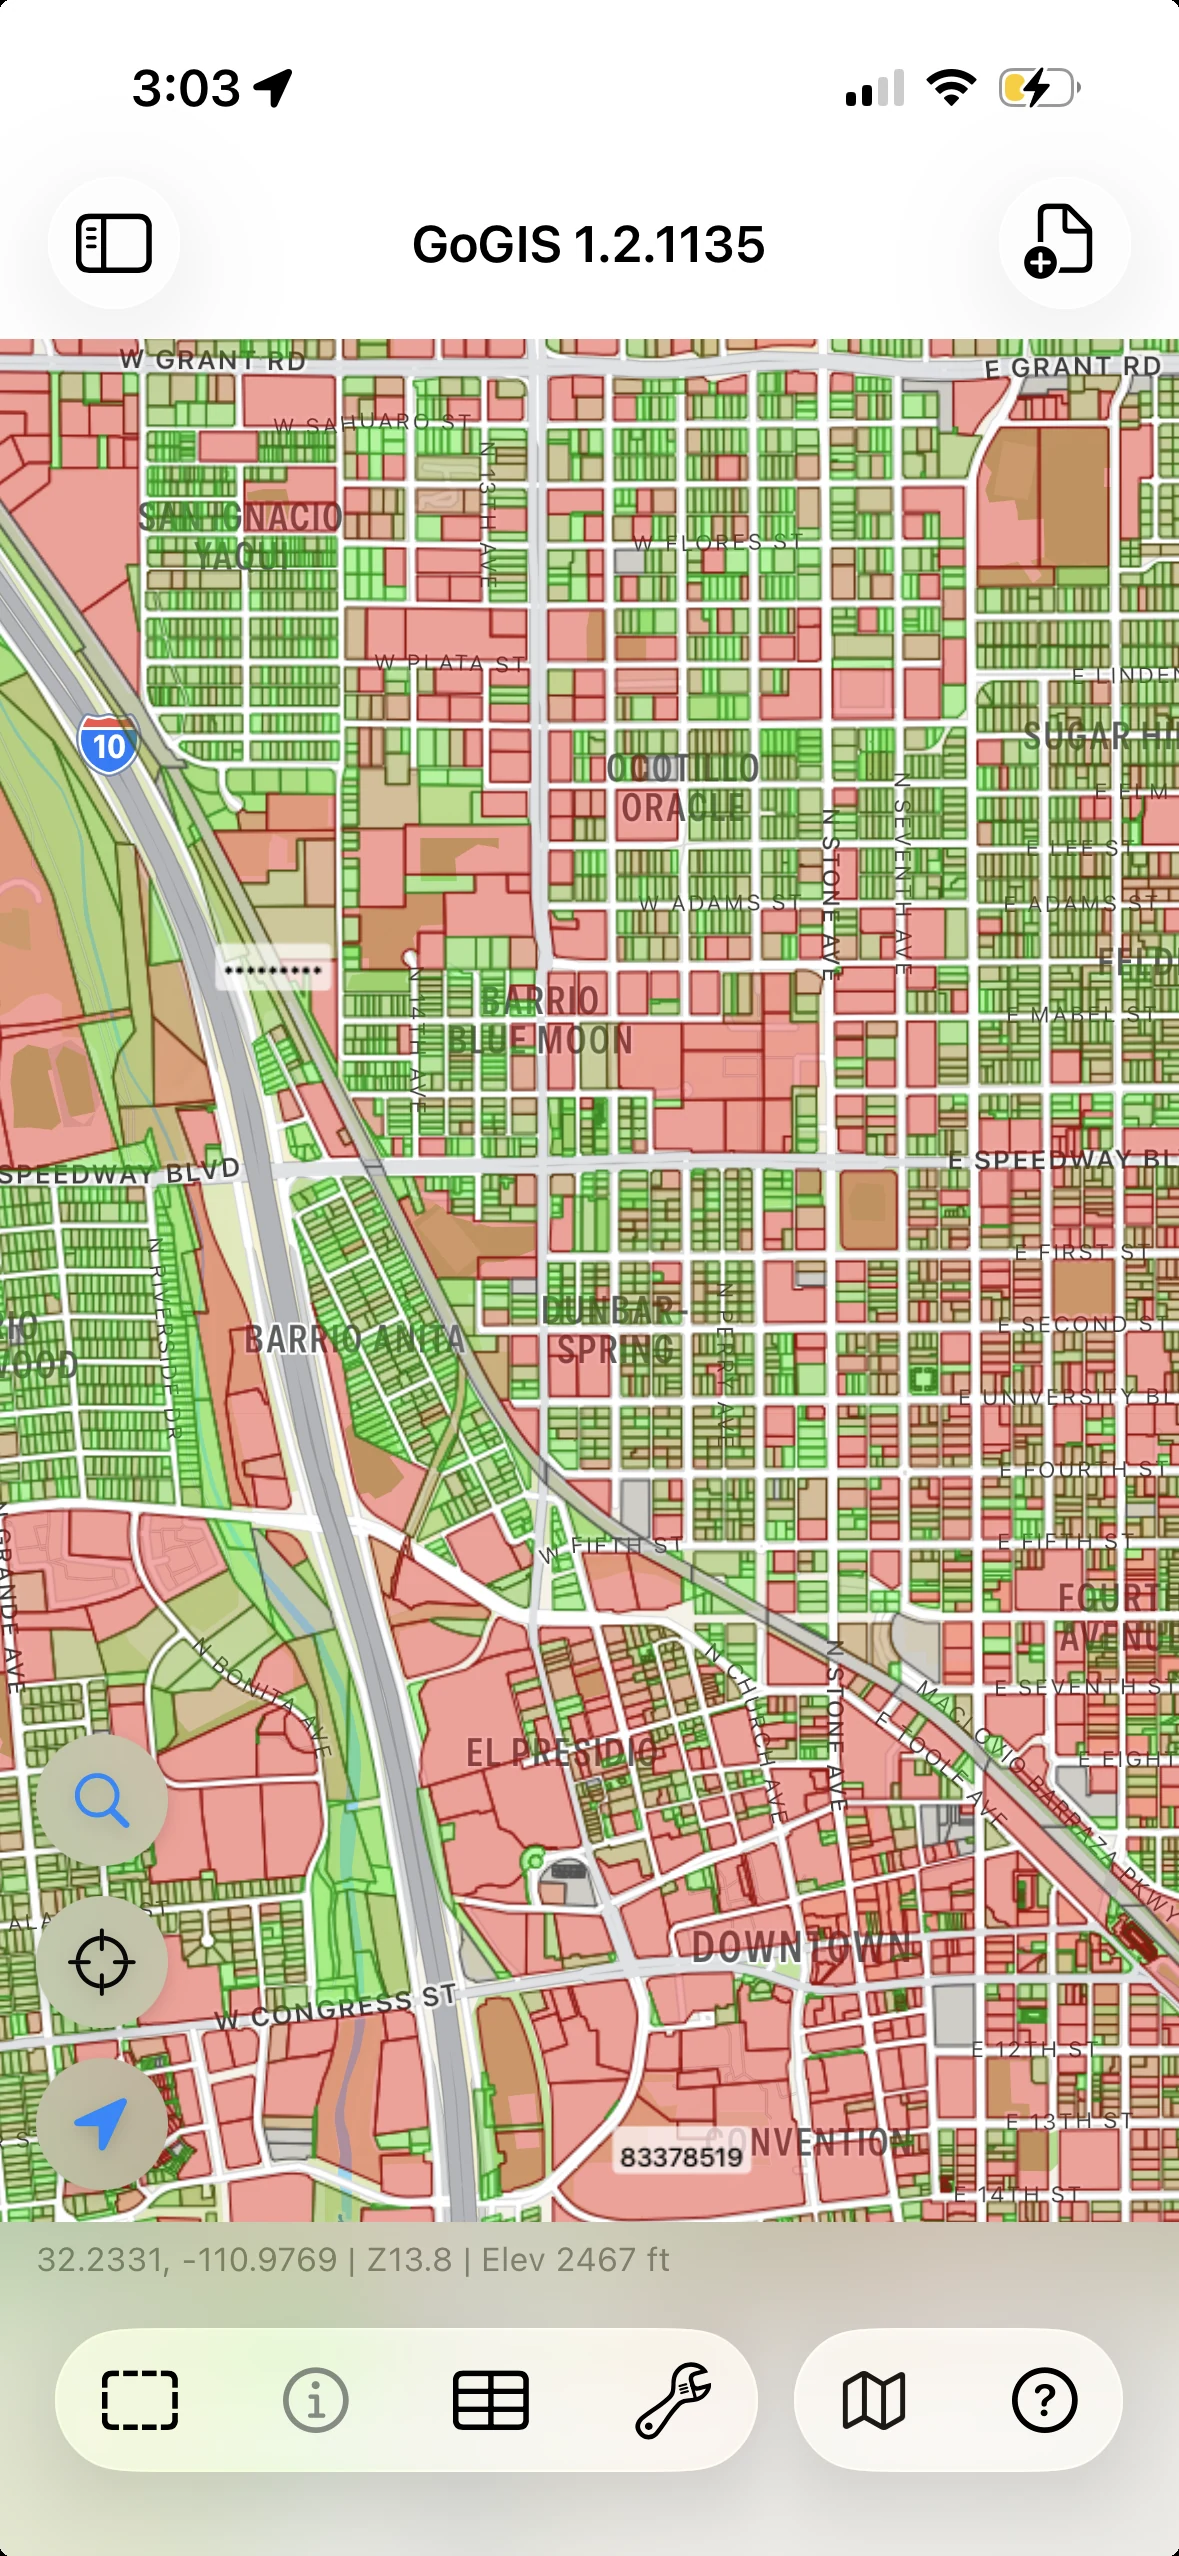
Make patterns visible.
Style features by attribute and add labels to bring useful differences into view.
One-time purchase. No subscription.US prices in USD. Local pricing varies.
Visualize maps, collect structured records, and run spatial analysis on your phone or tablet. GoGIS brings your data and the tools to work with it into the field.
Explore the work ↓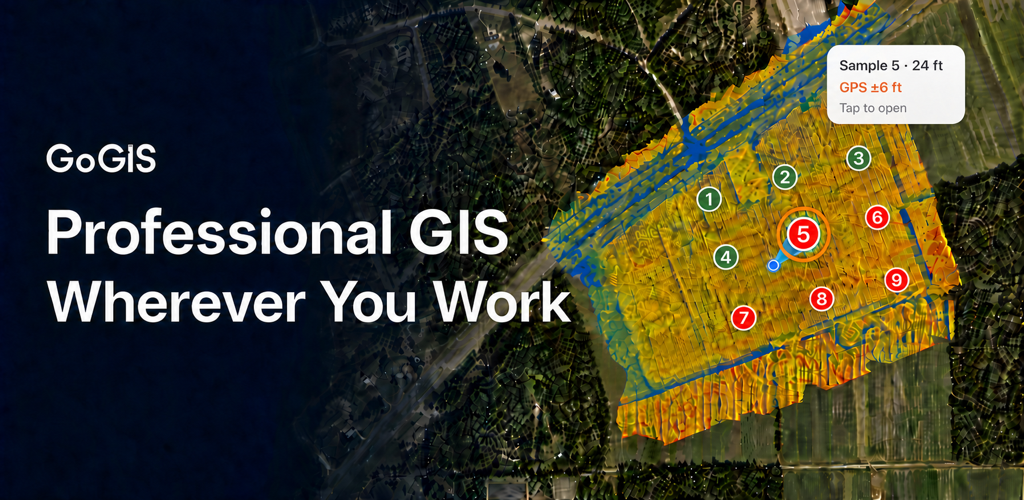
Open a file to understand a location. Record what you find there. Use the data to answer a spatial question.
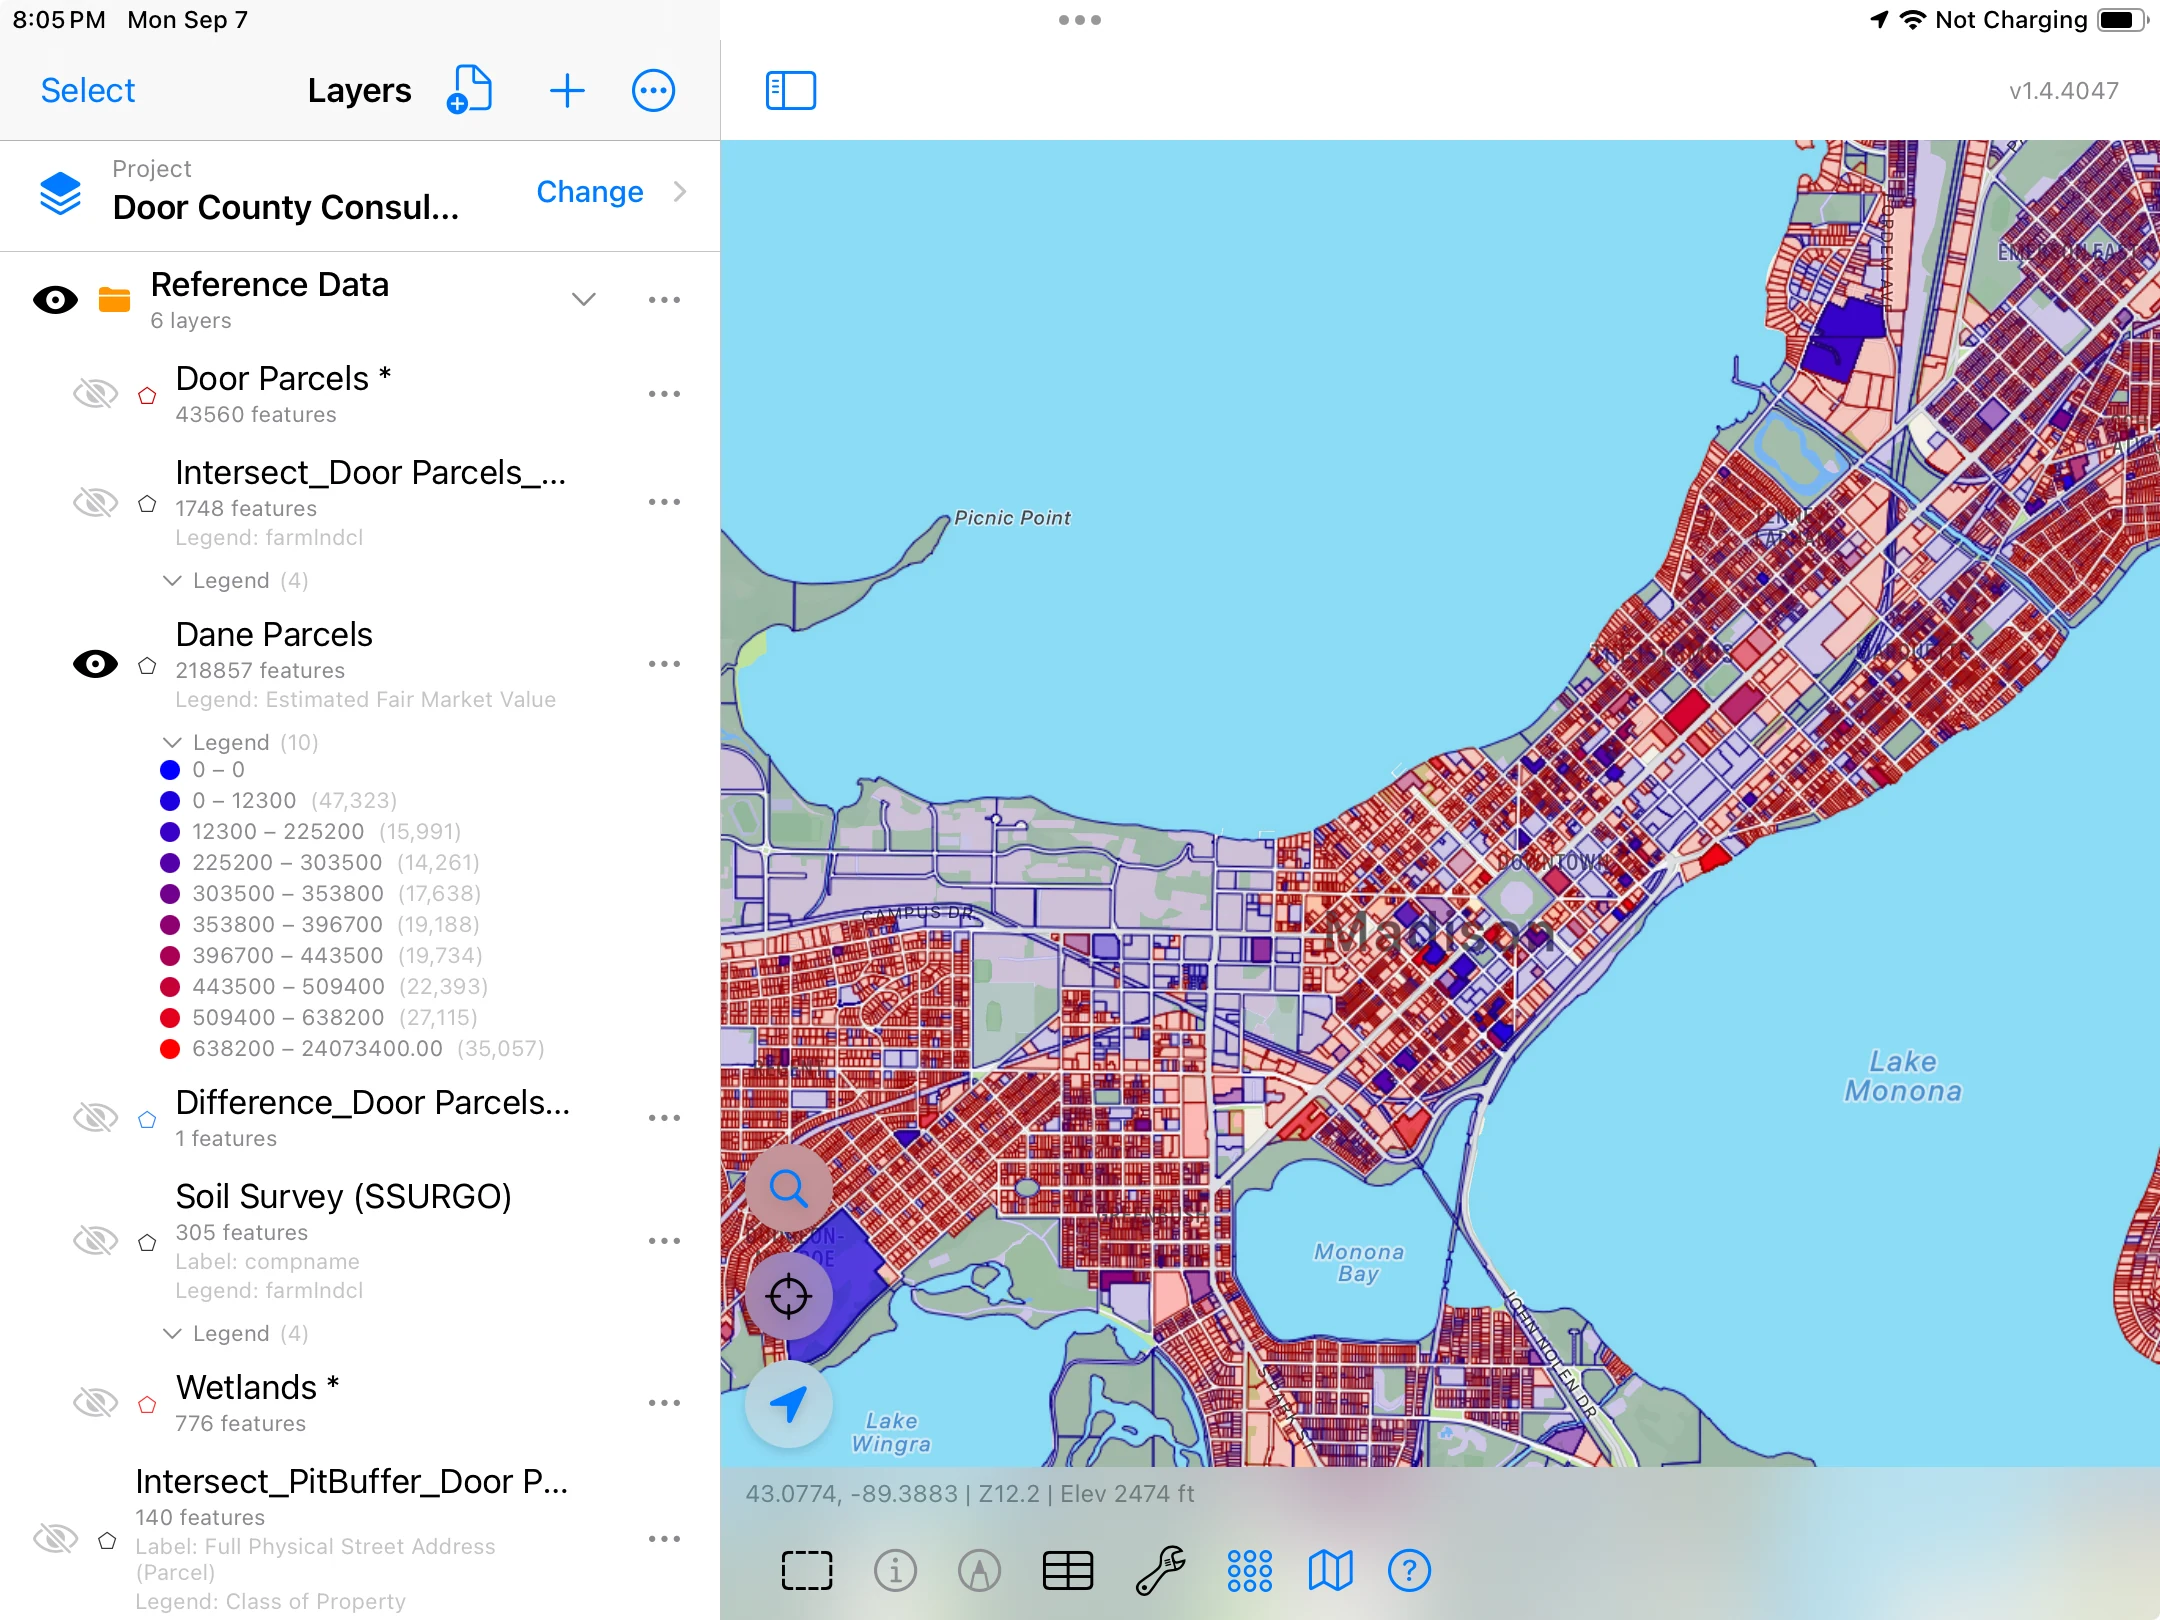
Style features by attribute and add labels to bring useful differences into view.
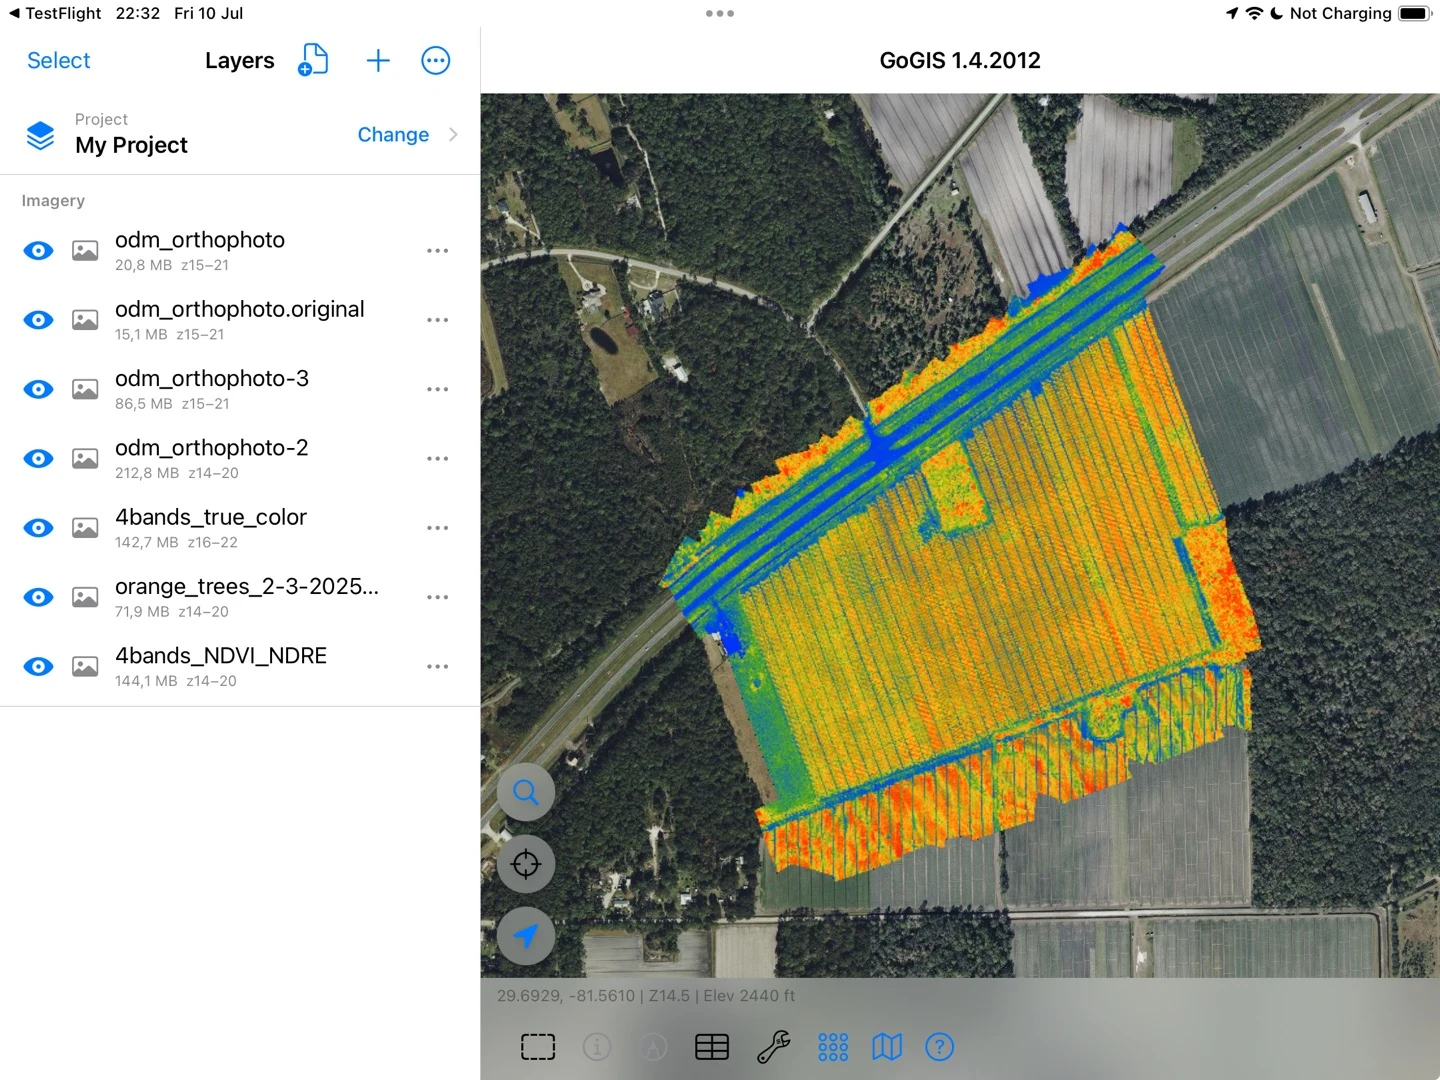
Combine your imagery with other GIS layers to compare what they show at the same location.
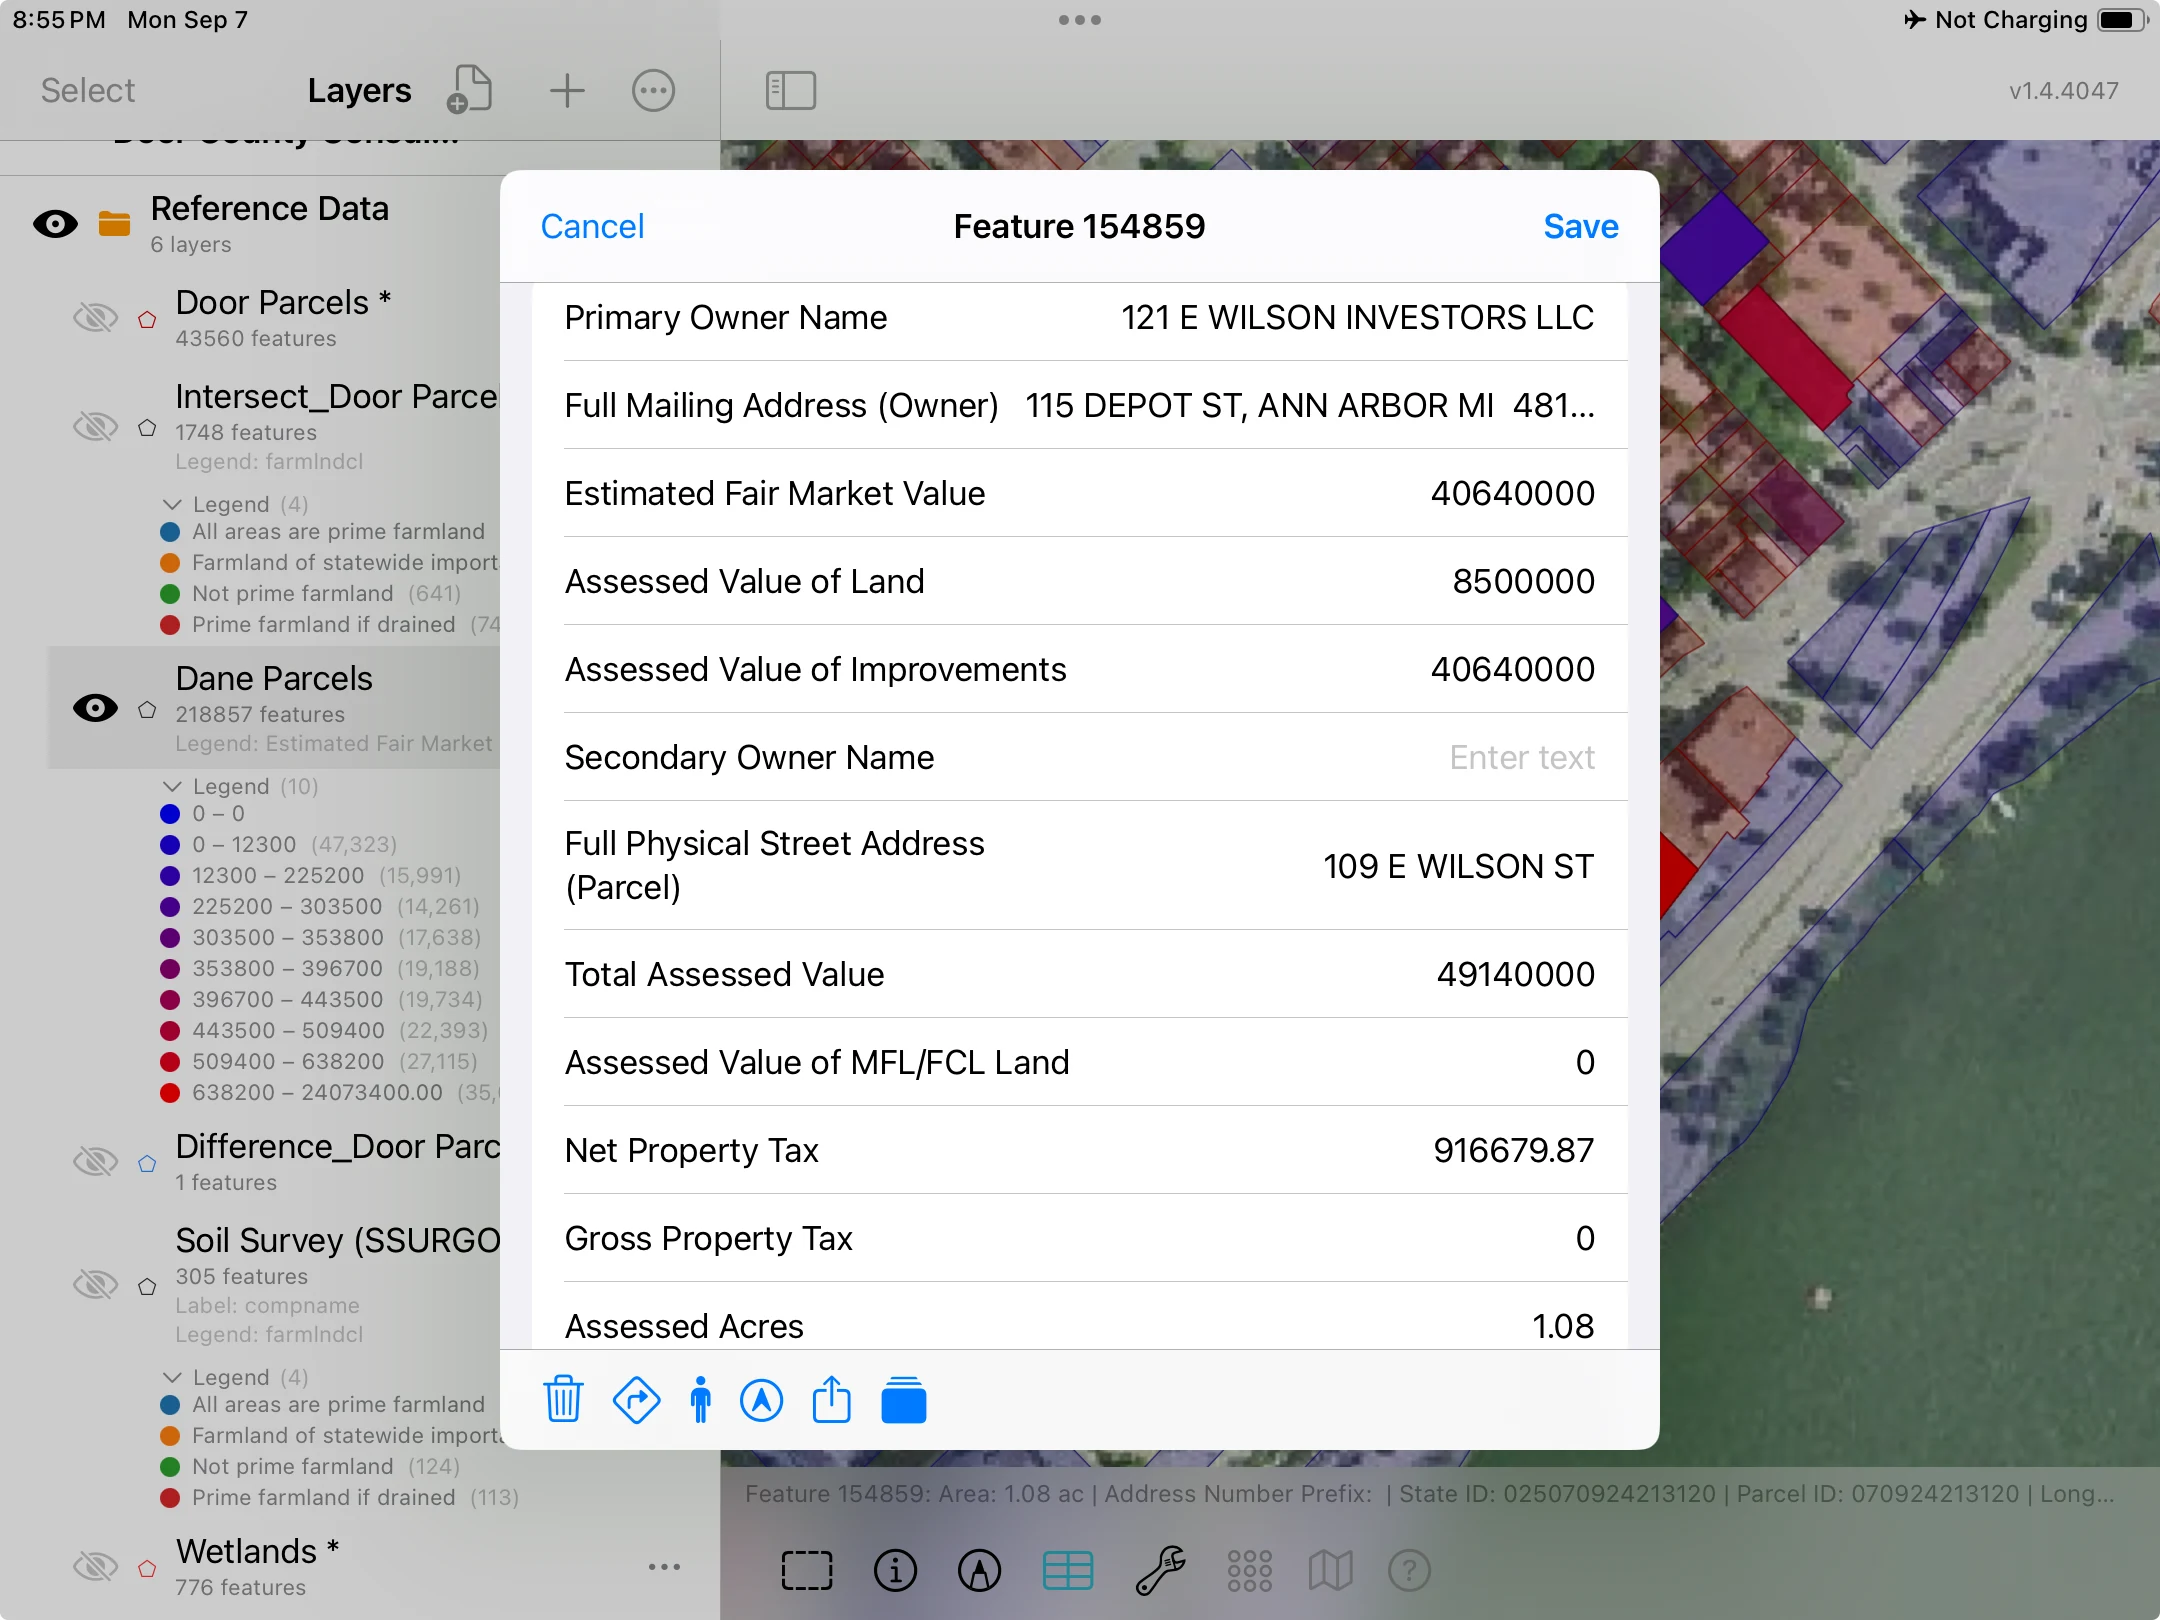
Select a feature to inspect its attributes—the information behind the point, line, or boundary.
Bring in your GIS files and imagery. Style layers, label features, and inspect their attributes in the context of the map.
Maps, legends & attributes →Working with large datasets →Build forms with pick lists, photos, formulas, and conditional fields. Keep repeated inspections and measurements linked to the same feature.
Explore custom forms →See records in context ↓Buffer a stream, intersect fields with soils, subtract exclusions, or dissolve features by attribute. Run geometry operations on the device.
See geometry operations in use ↓Working with soils & flood maps →Record inspections, attach photographs, and keep each visit connected to the mapped asset. Your reference layers stay close at hand while you work.
Explore custom forms →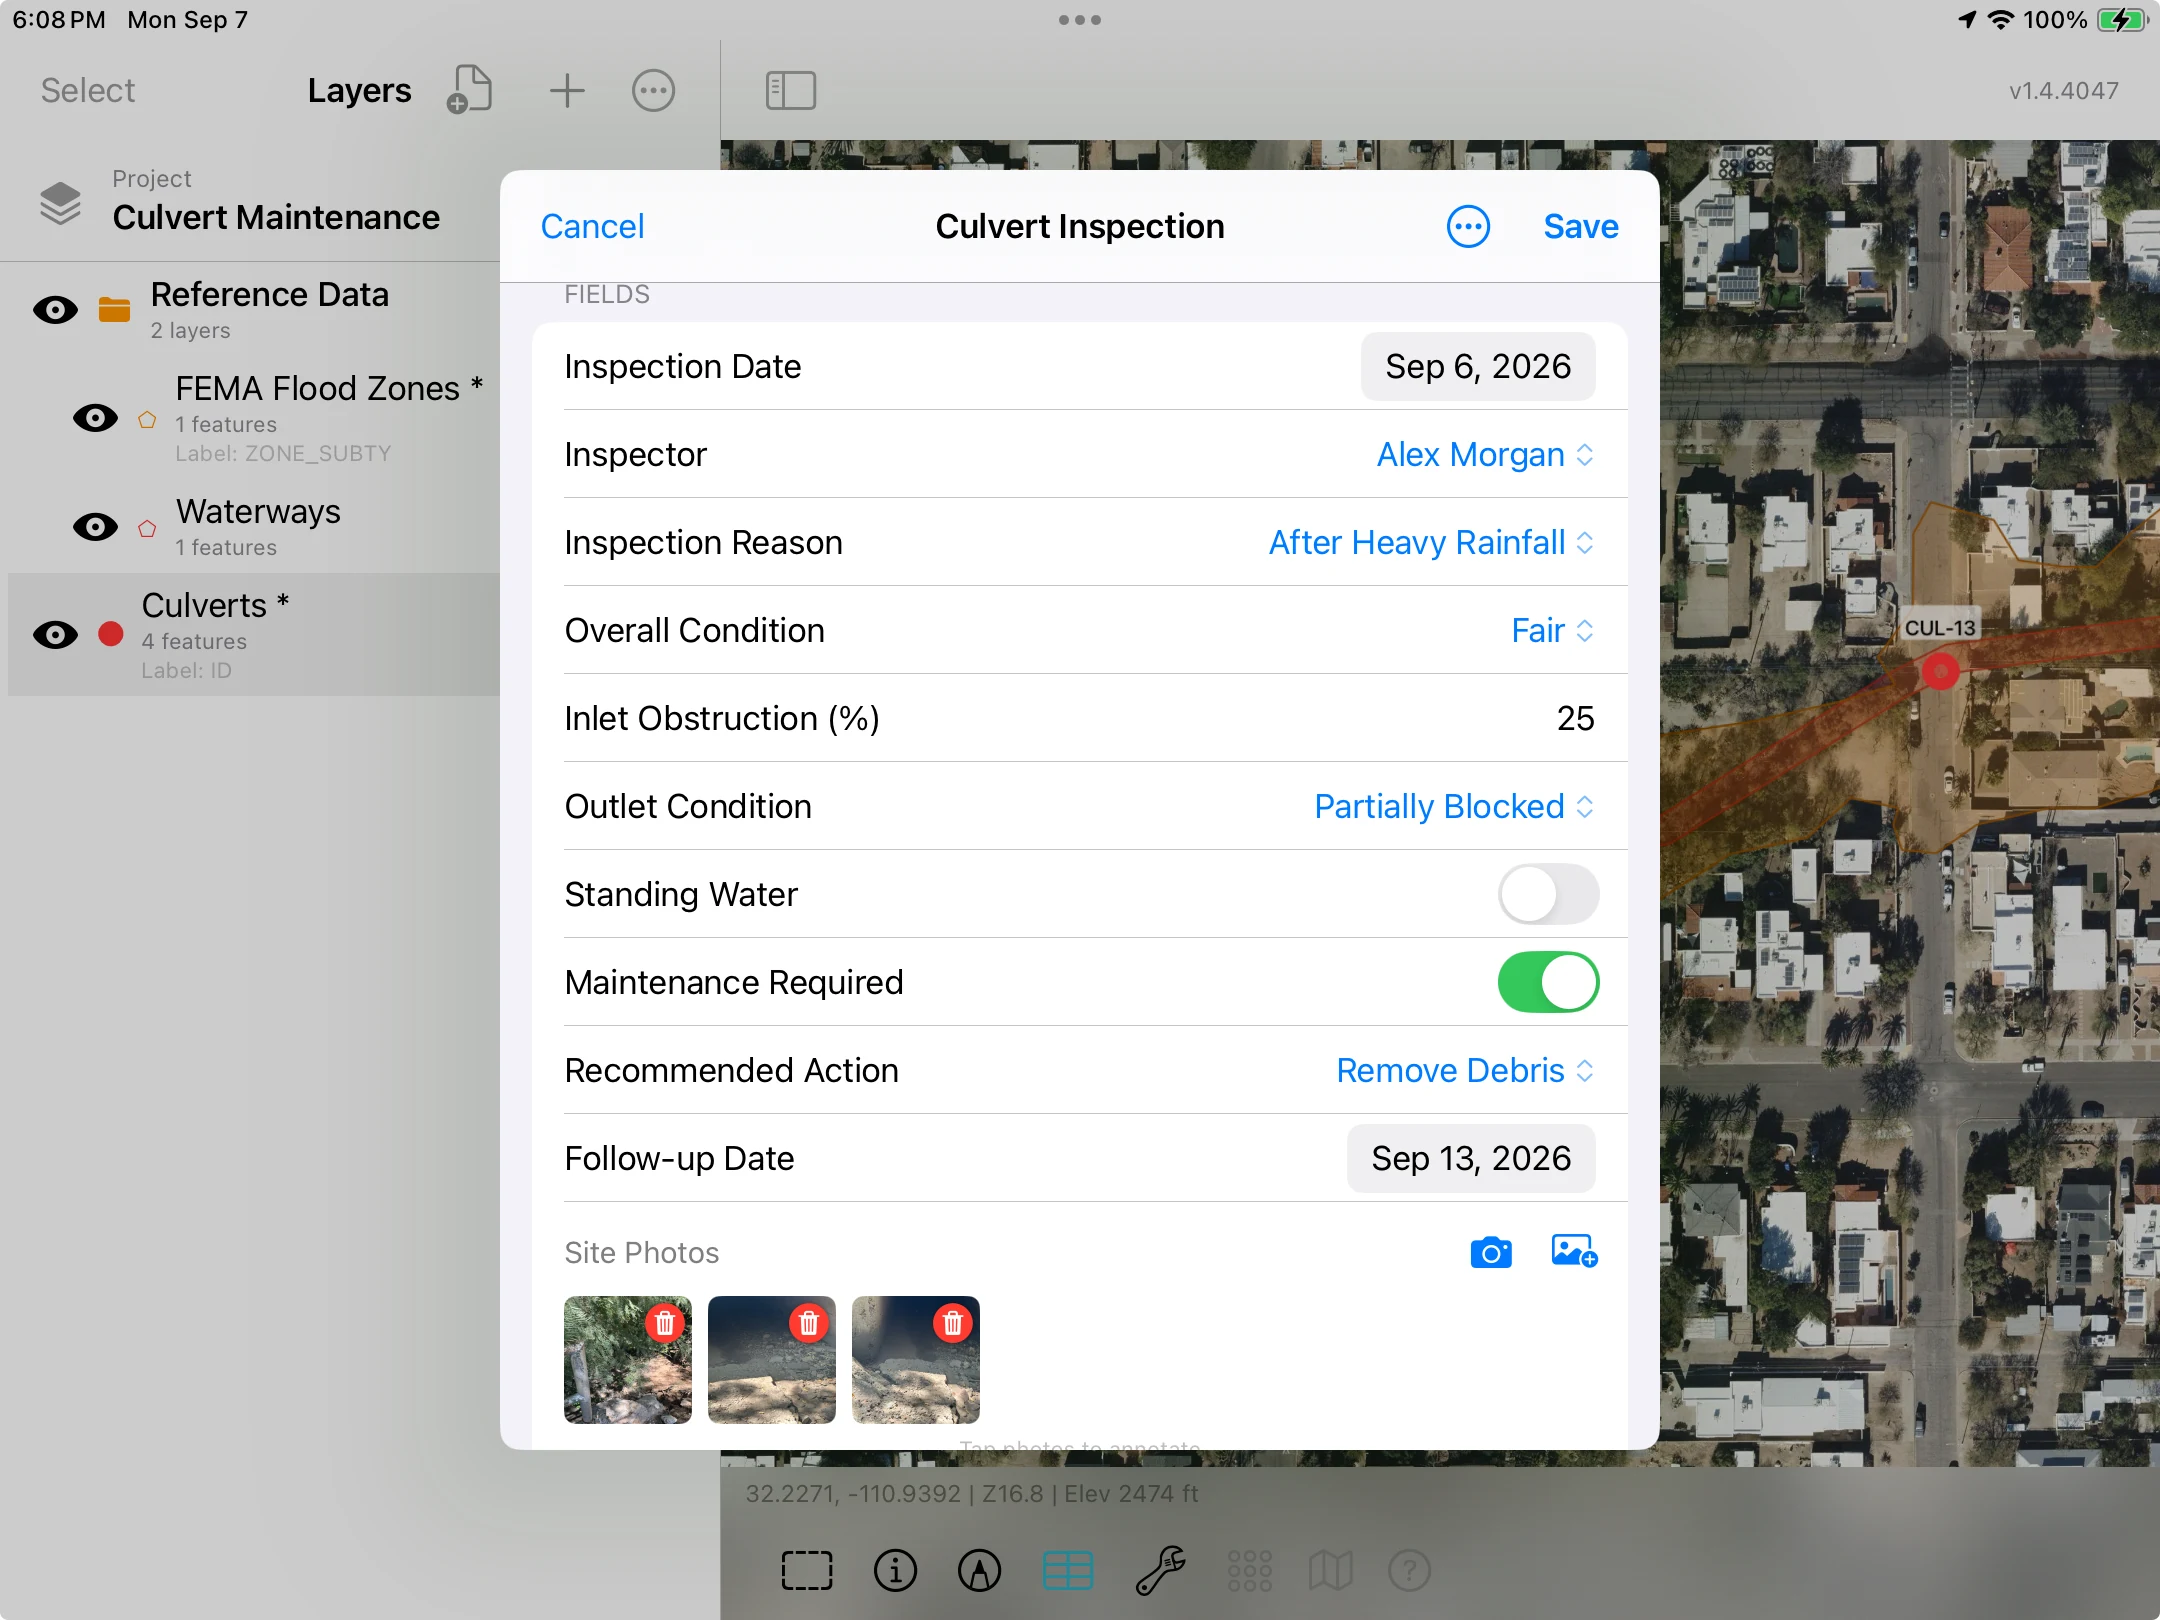
Build forms with pick lists, measurements, photographs, and calculated values. Conditional fields let you show follow-up questions when they apply.
Use related forms to add a separate record for each visit. Review dates, conditions, and measurements together in the grid without replacing earlier inspections.
Explore related records →Open a feature’s form, change an individual cell in the Attribute Grid, or select several records and apply the same value to them. Correct one measurement or assign a shared priority without reopening each form.
See how individual and bulk editing work →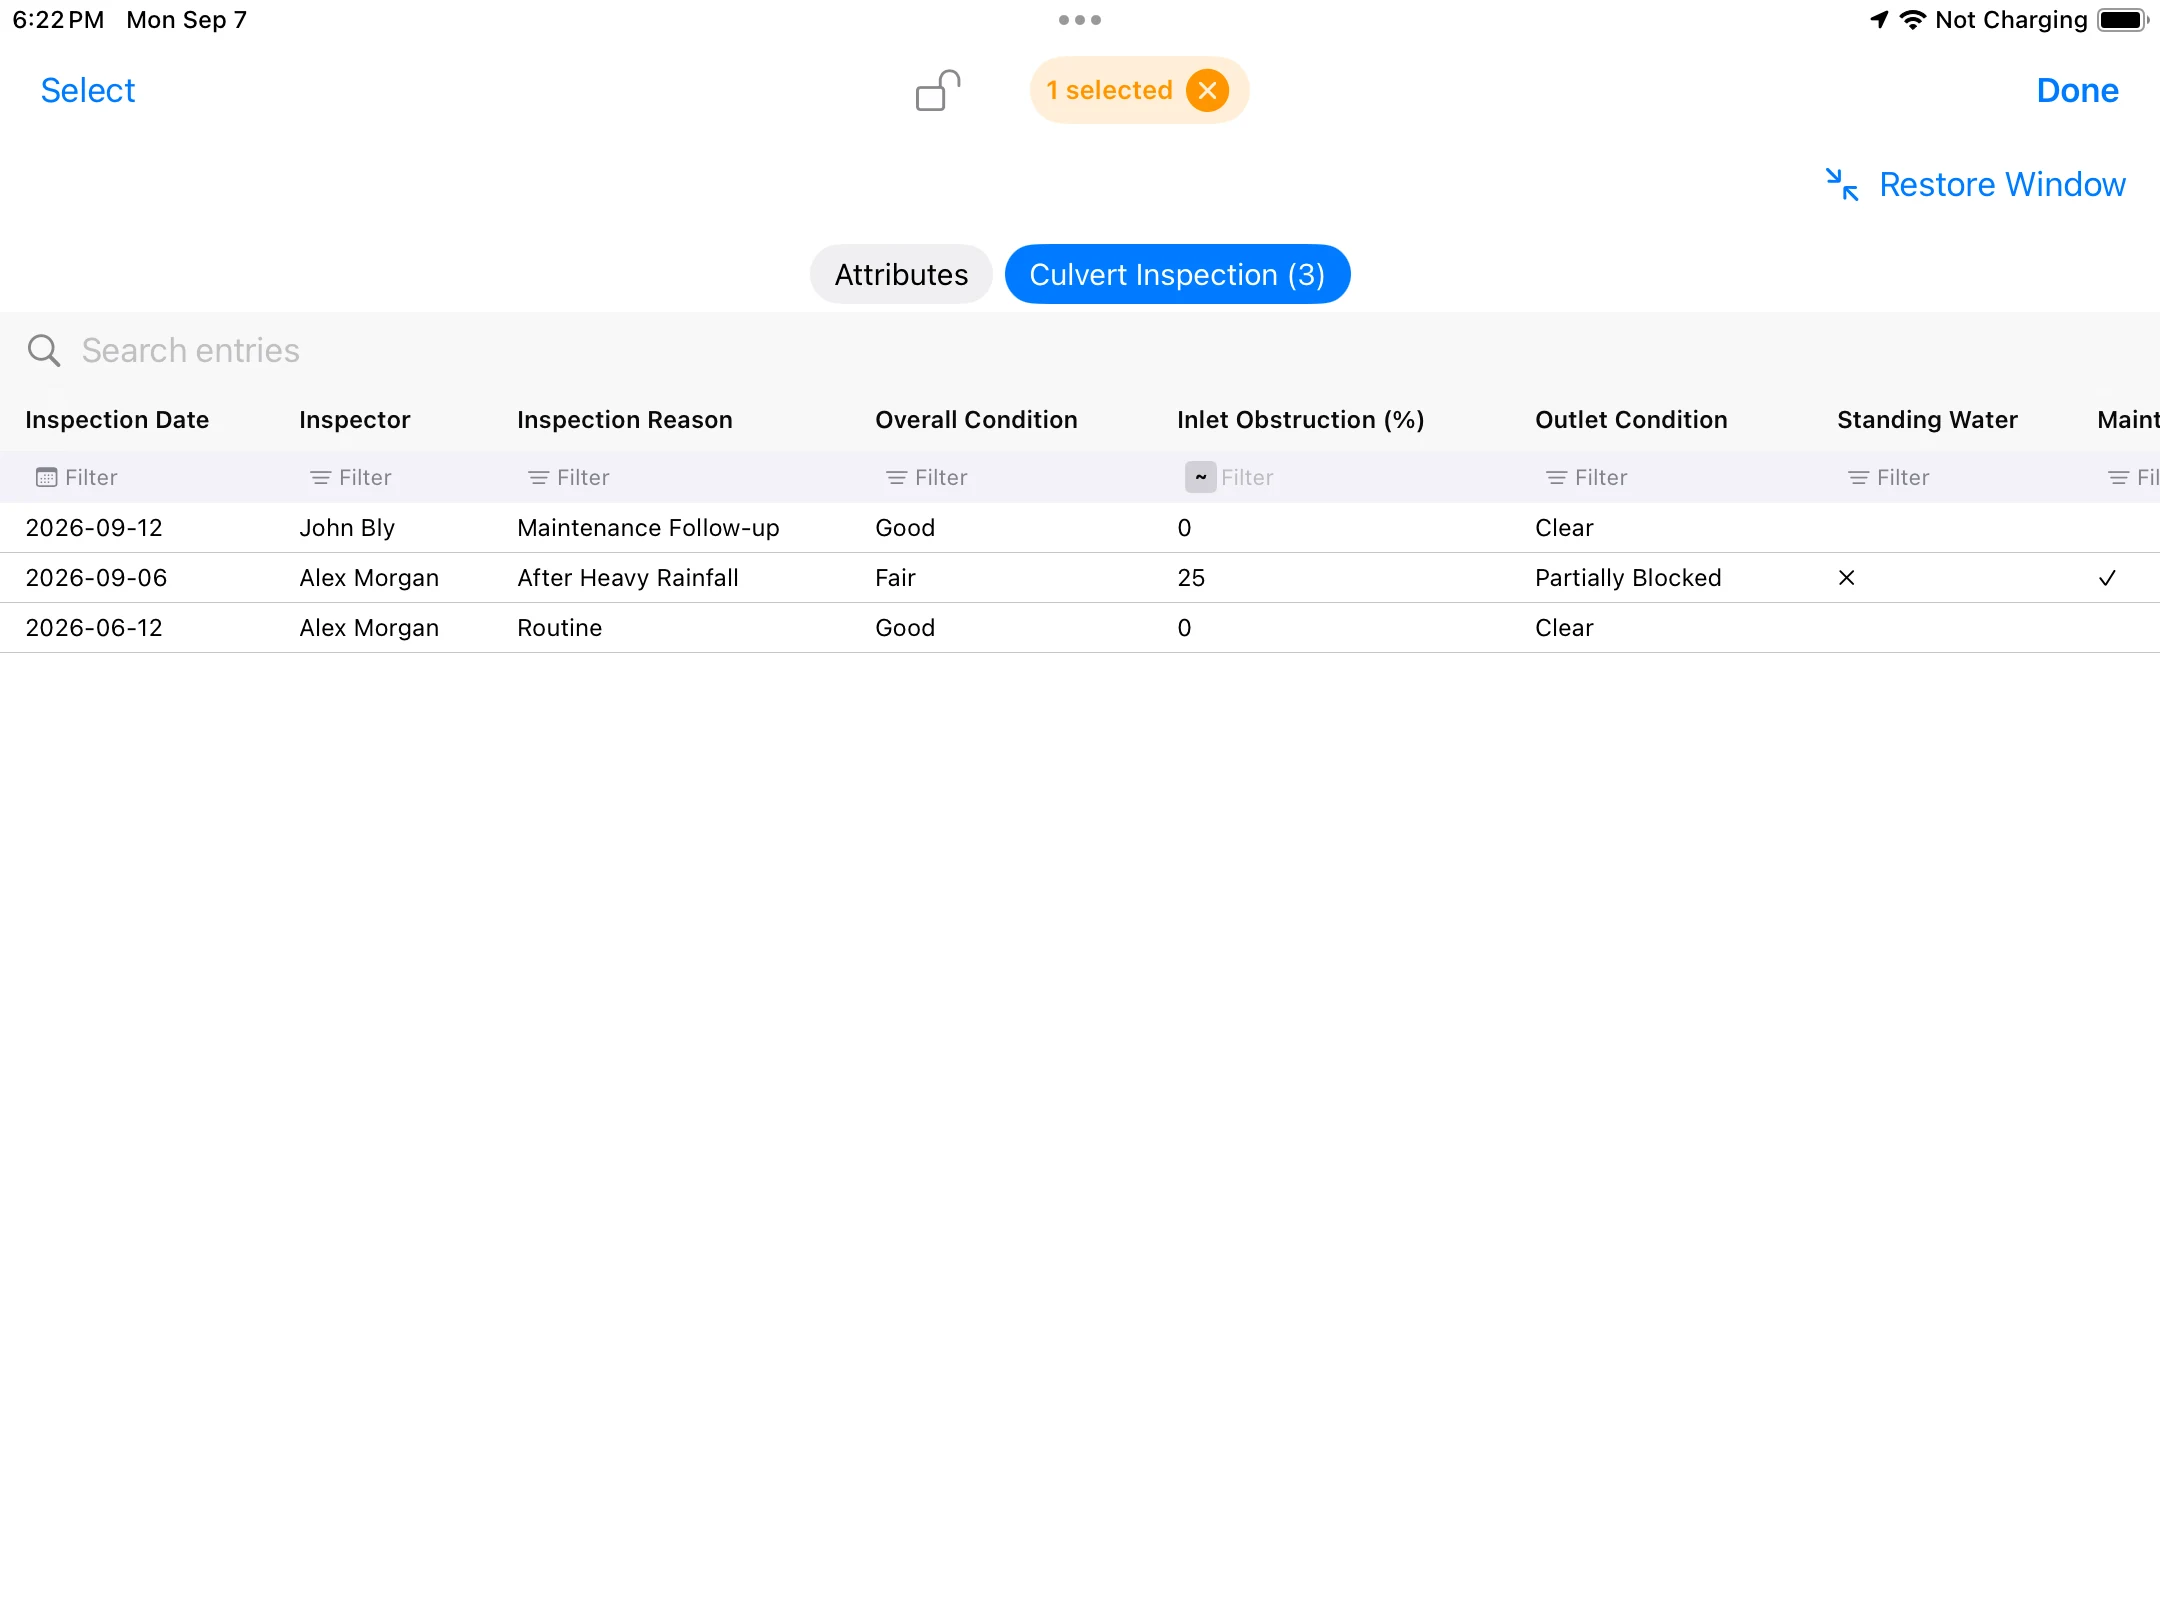
Export a PDF with the culvert locations, reference layers, legend and scale. This example shows the inspection area; the visit records remain separate.
Open the culvert inspection map ↗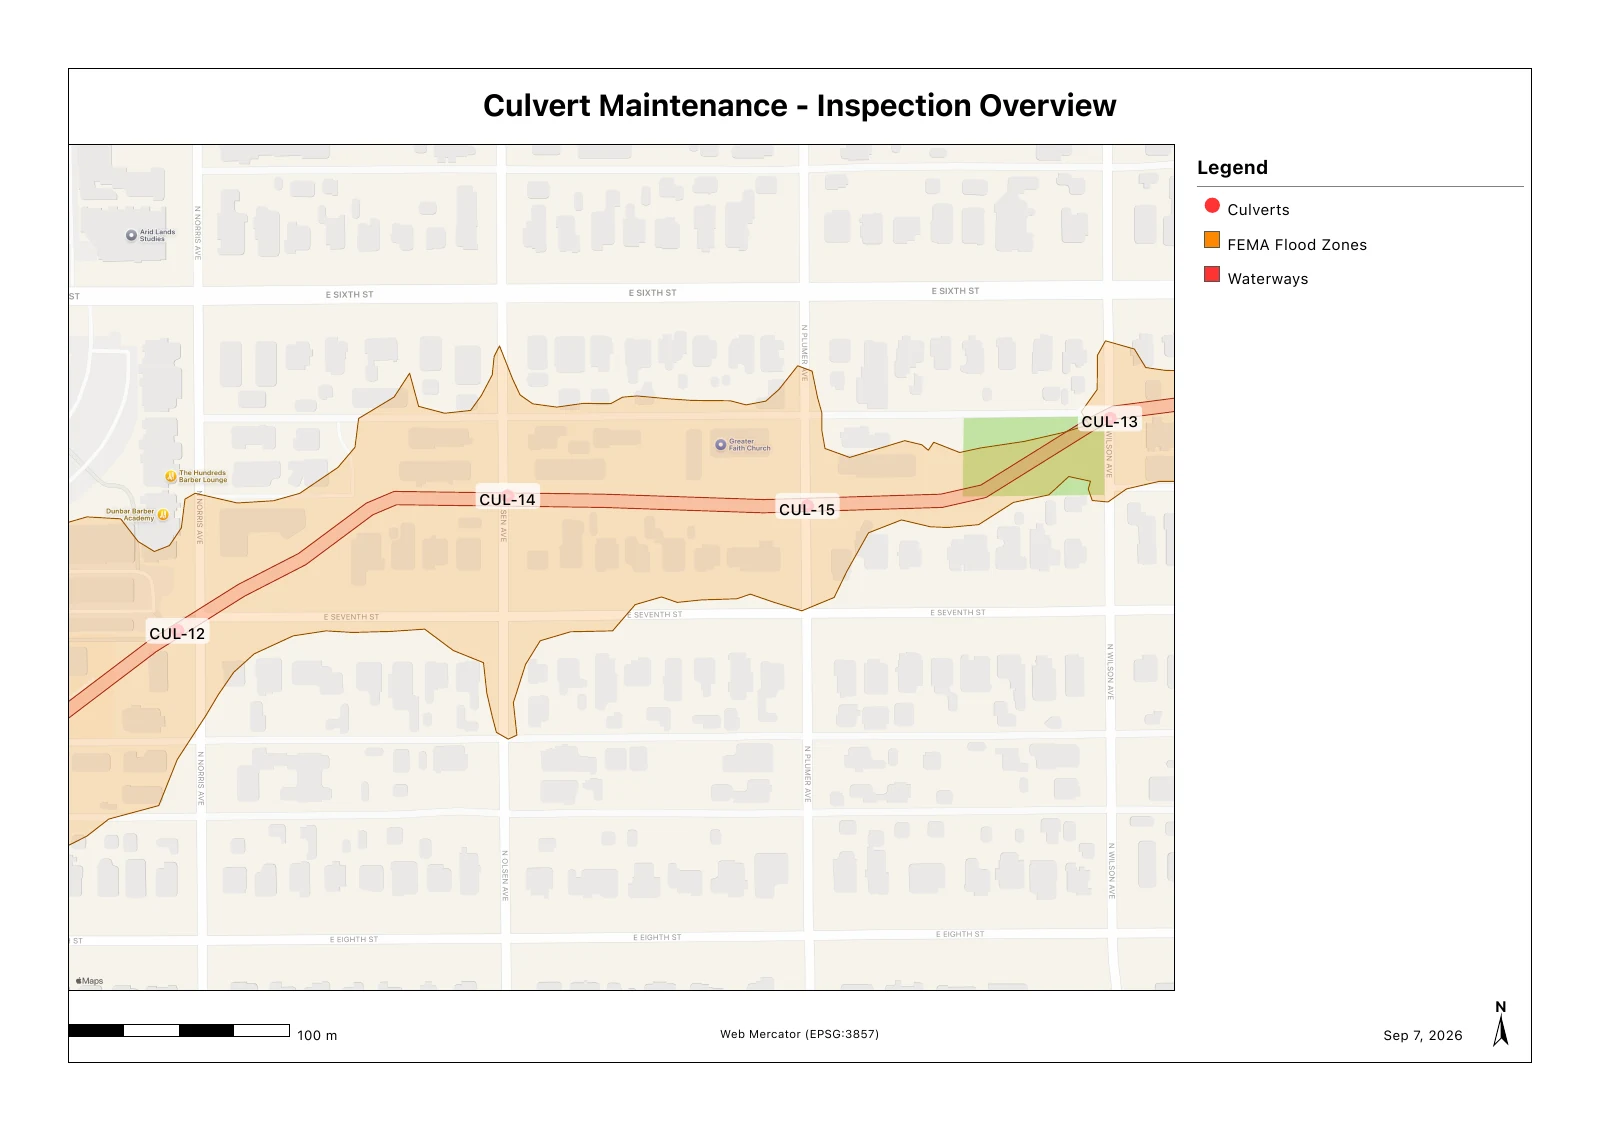
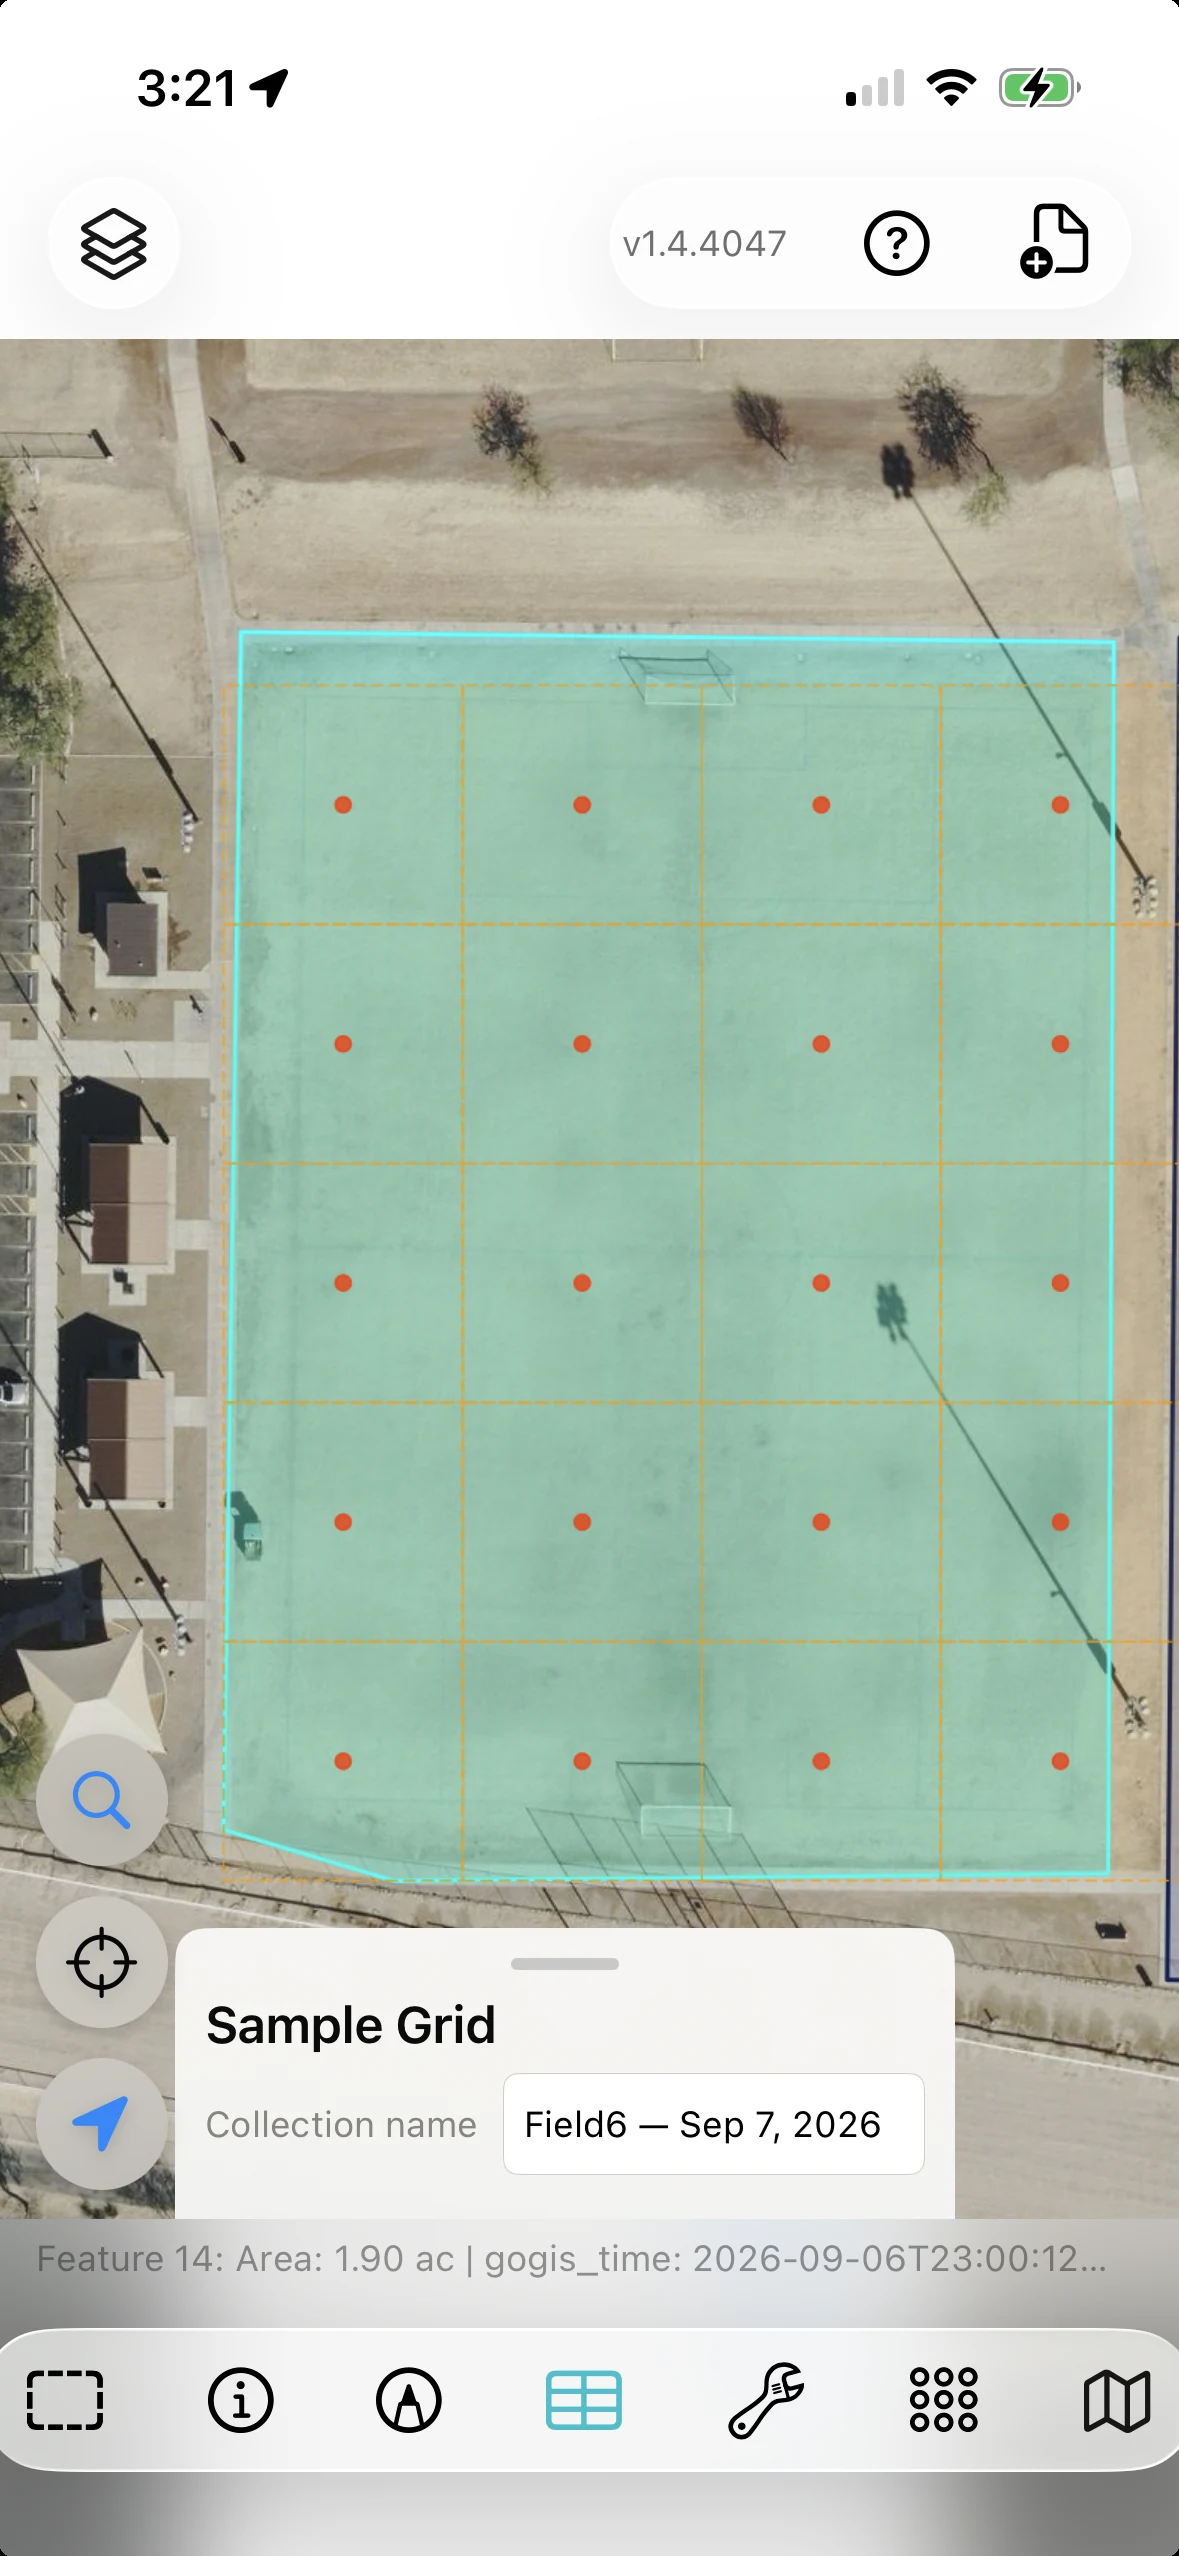
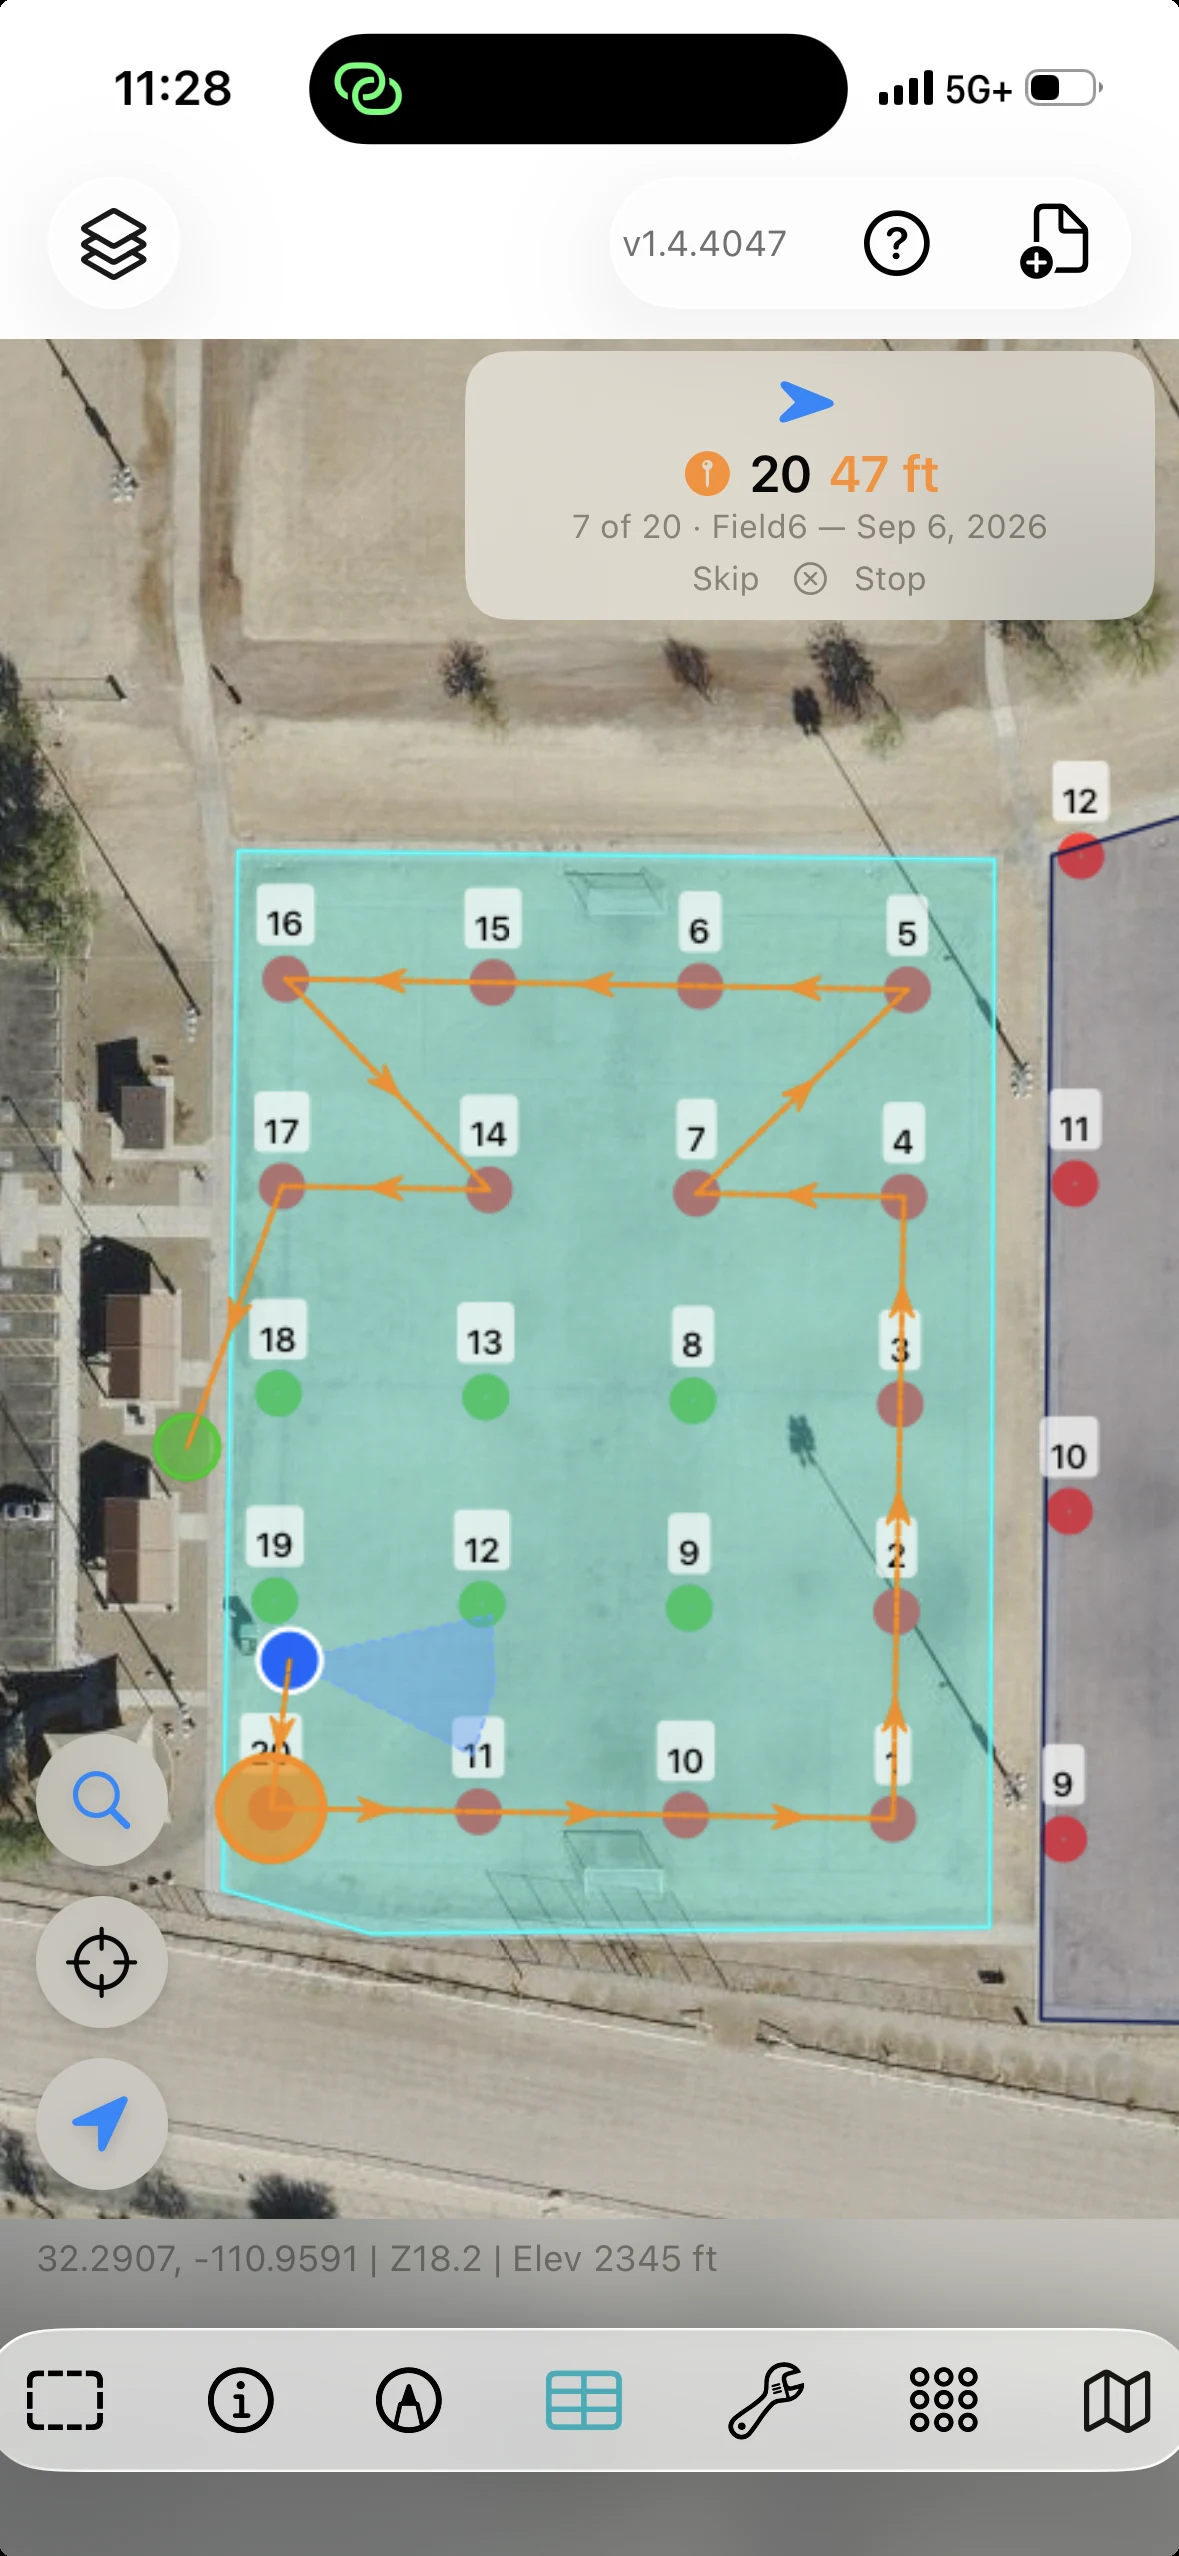
Lay out sample locations, follow the route, record each collection, and map the returned lab results. This turf demonstration follows the work at one site.
Generate a sampling grid within a boundary. Set the spacing, rotation, and offset to suit the area you need to cover.
Follow direction and distance to the next sample. Collection status and the remaining route stay visible as you move through the site.
Match returned lab results to samples by Bag ID. Create an interpolated surface from a numeric result to explore its spatial pattern.
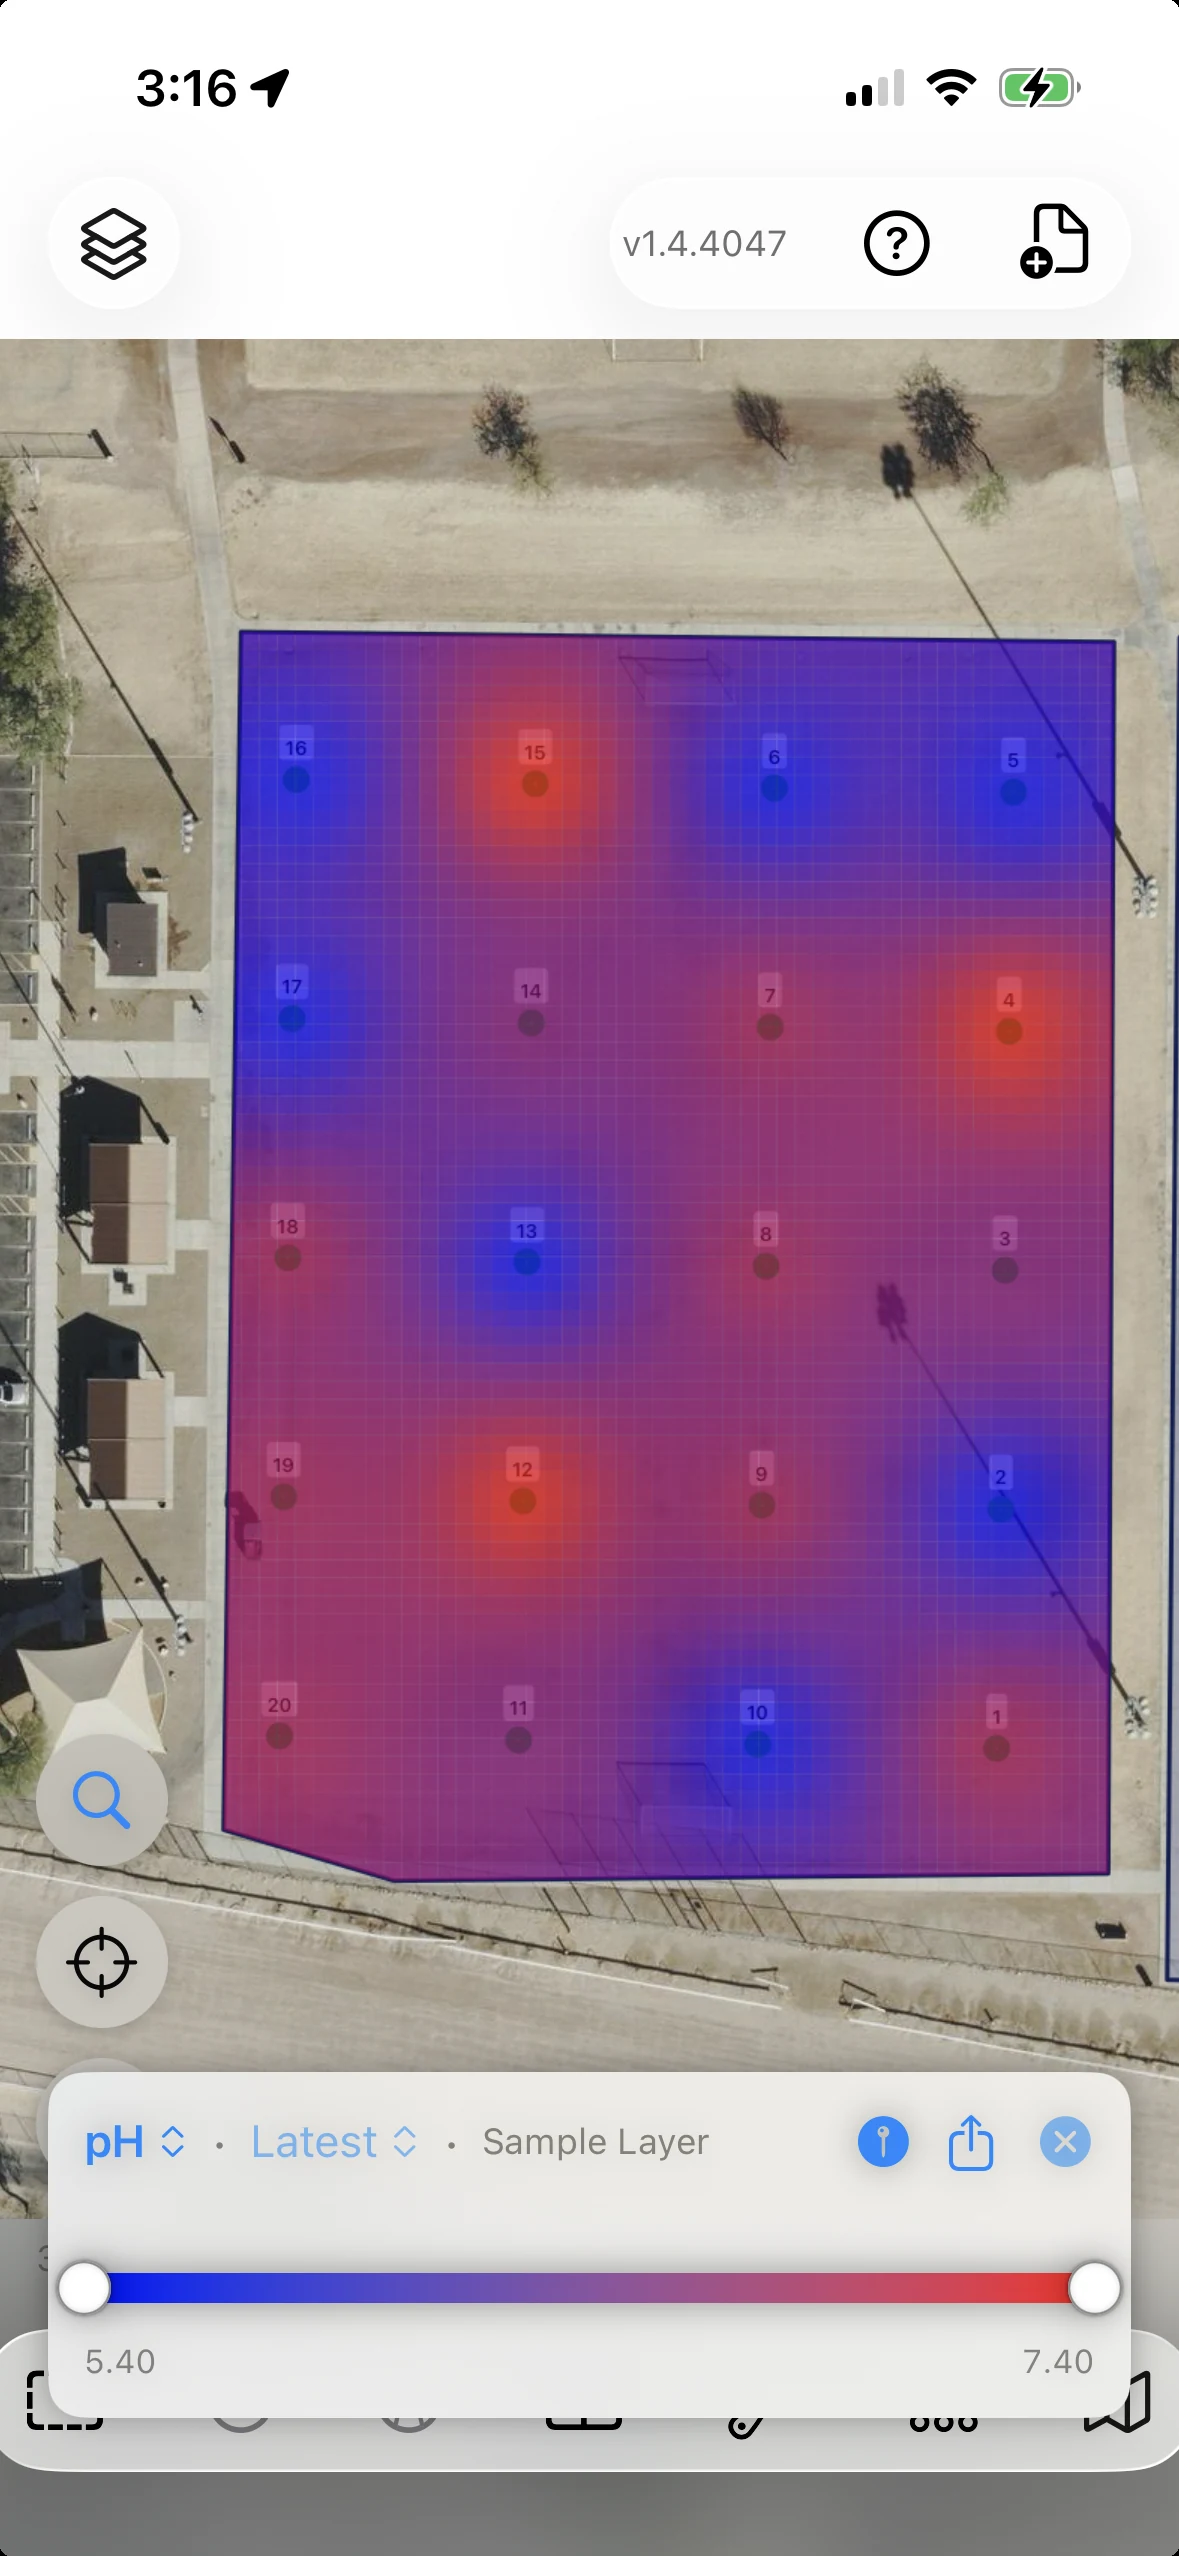
Demonstration project with illustrative lab results.
Print QR or barcode bag labels, capture observations in a form, and retain collection records alongside the sample locations.
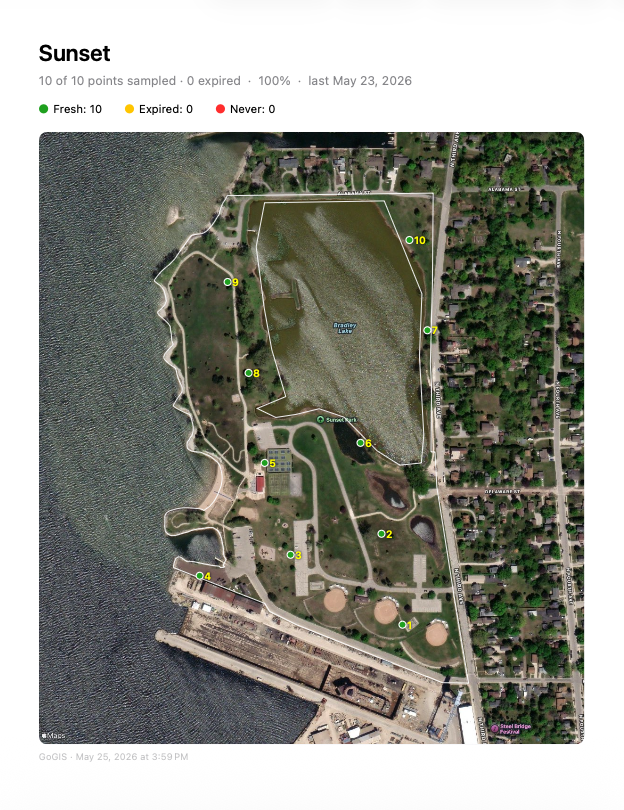
Collection, labels & related records →Export an overview map and heat-map pages for the result fields. Share the sample locations and their mapped results in a PDF.
Open the sample reportActual GoGIS output from a separate demonstration project, using example data.
Measure what remains after excluding an area. Find the parcels around a proposed site. Use buffer, intersection, and difference operations to turn mapped boundaries into results you can inspect and export.
Subtract the wetland polygons from a parcel to create a new layer containing the area outside mapped wetlands.
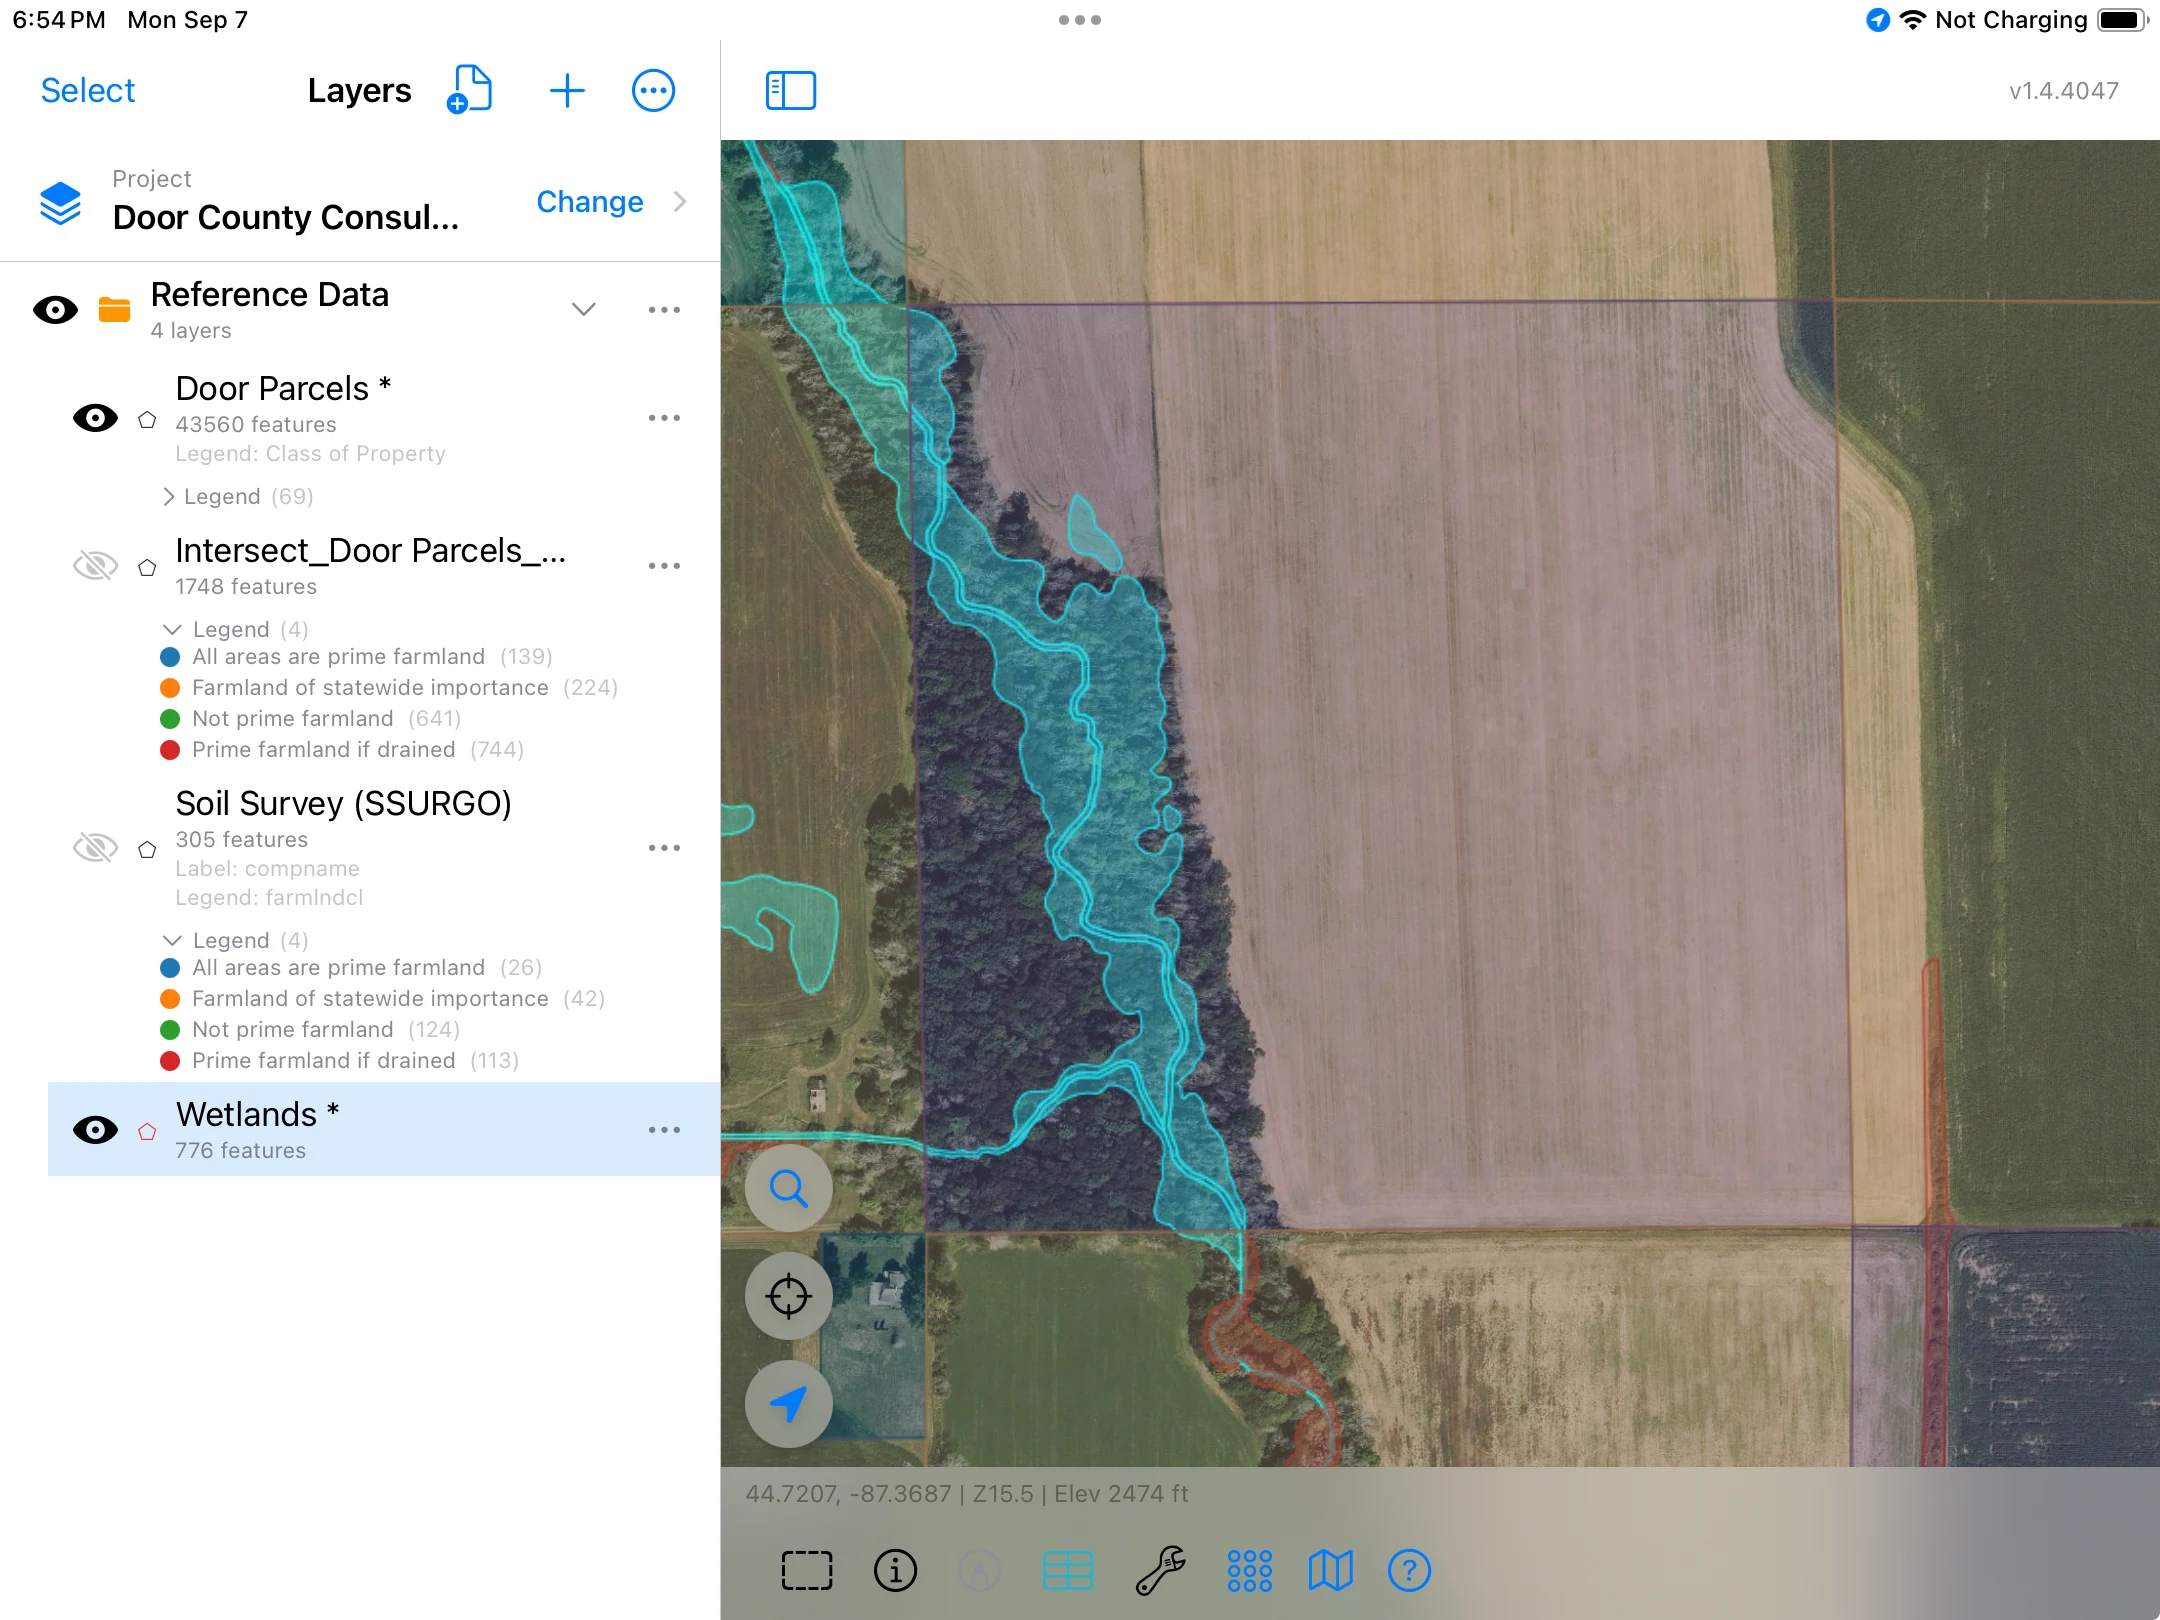
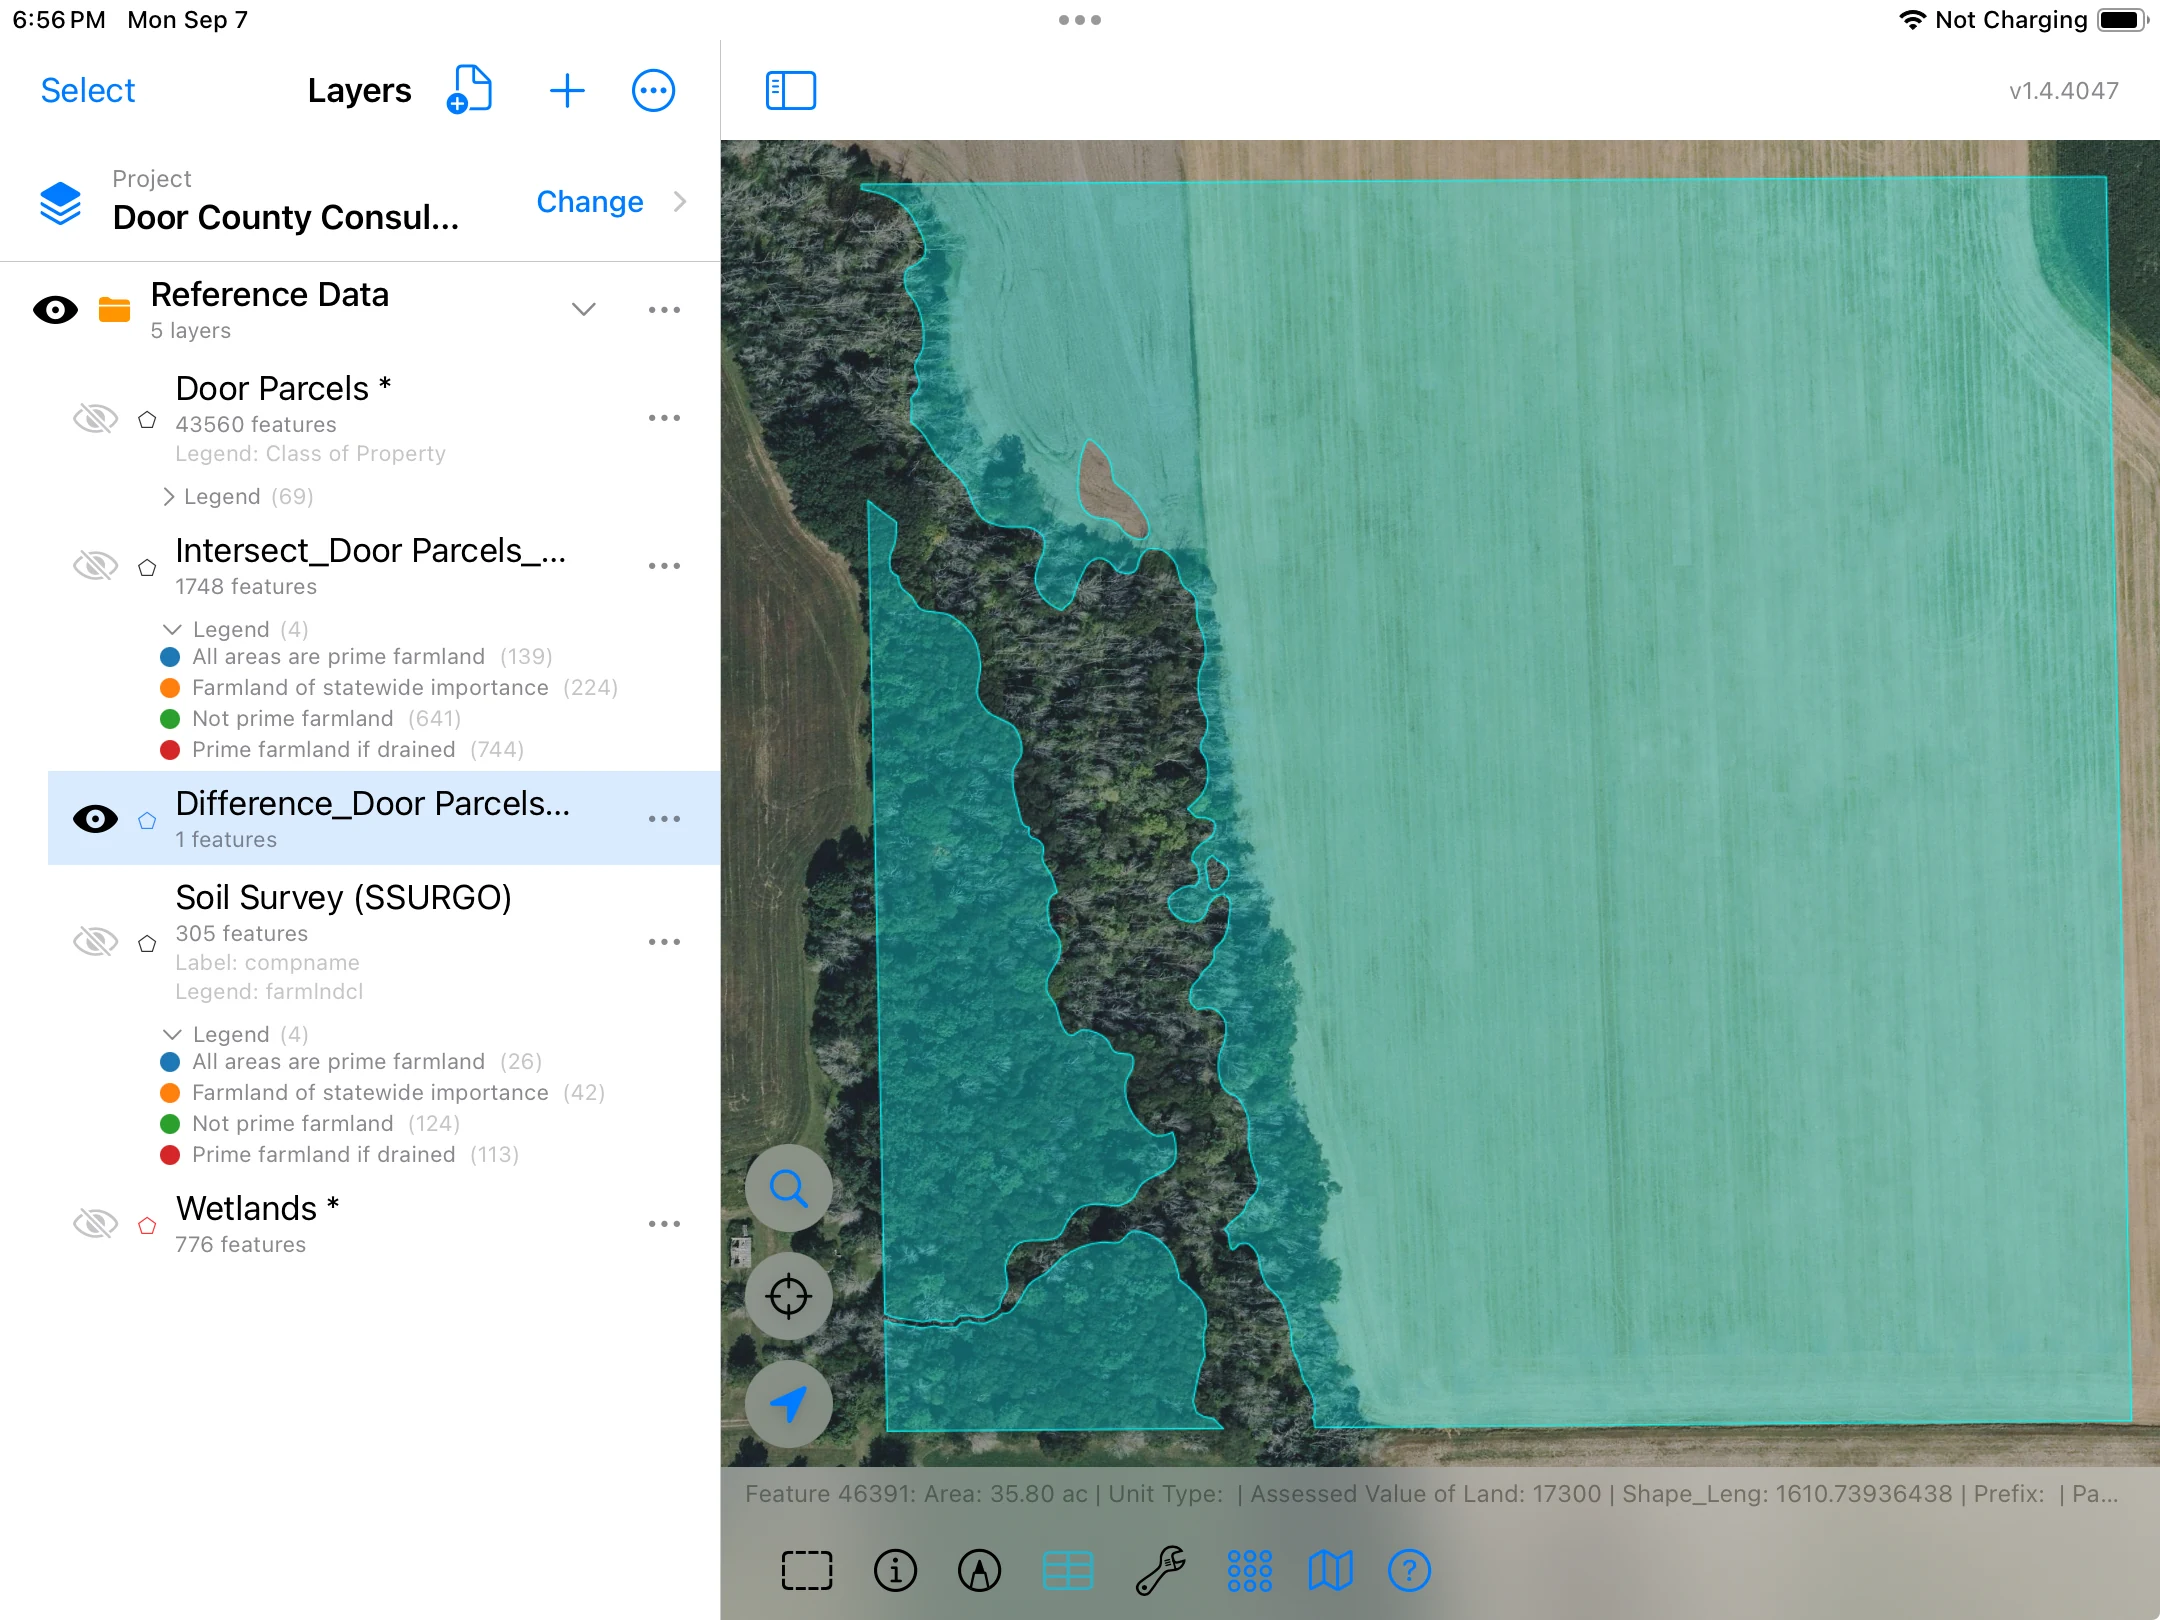
Areas shown for this example, rounded to two decimal places. The result measures land outside the mapped wetlands; it does not establish suitability for a particular use.
Create a one-mile buffer around the proposed footprint, then intersect it with the parcel layer. Review the overlapping portions together with their parcel attributes.
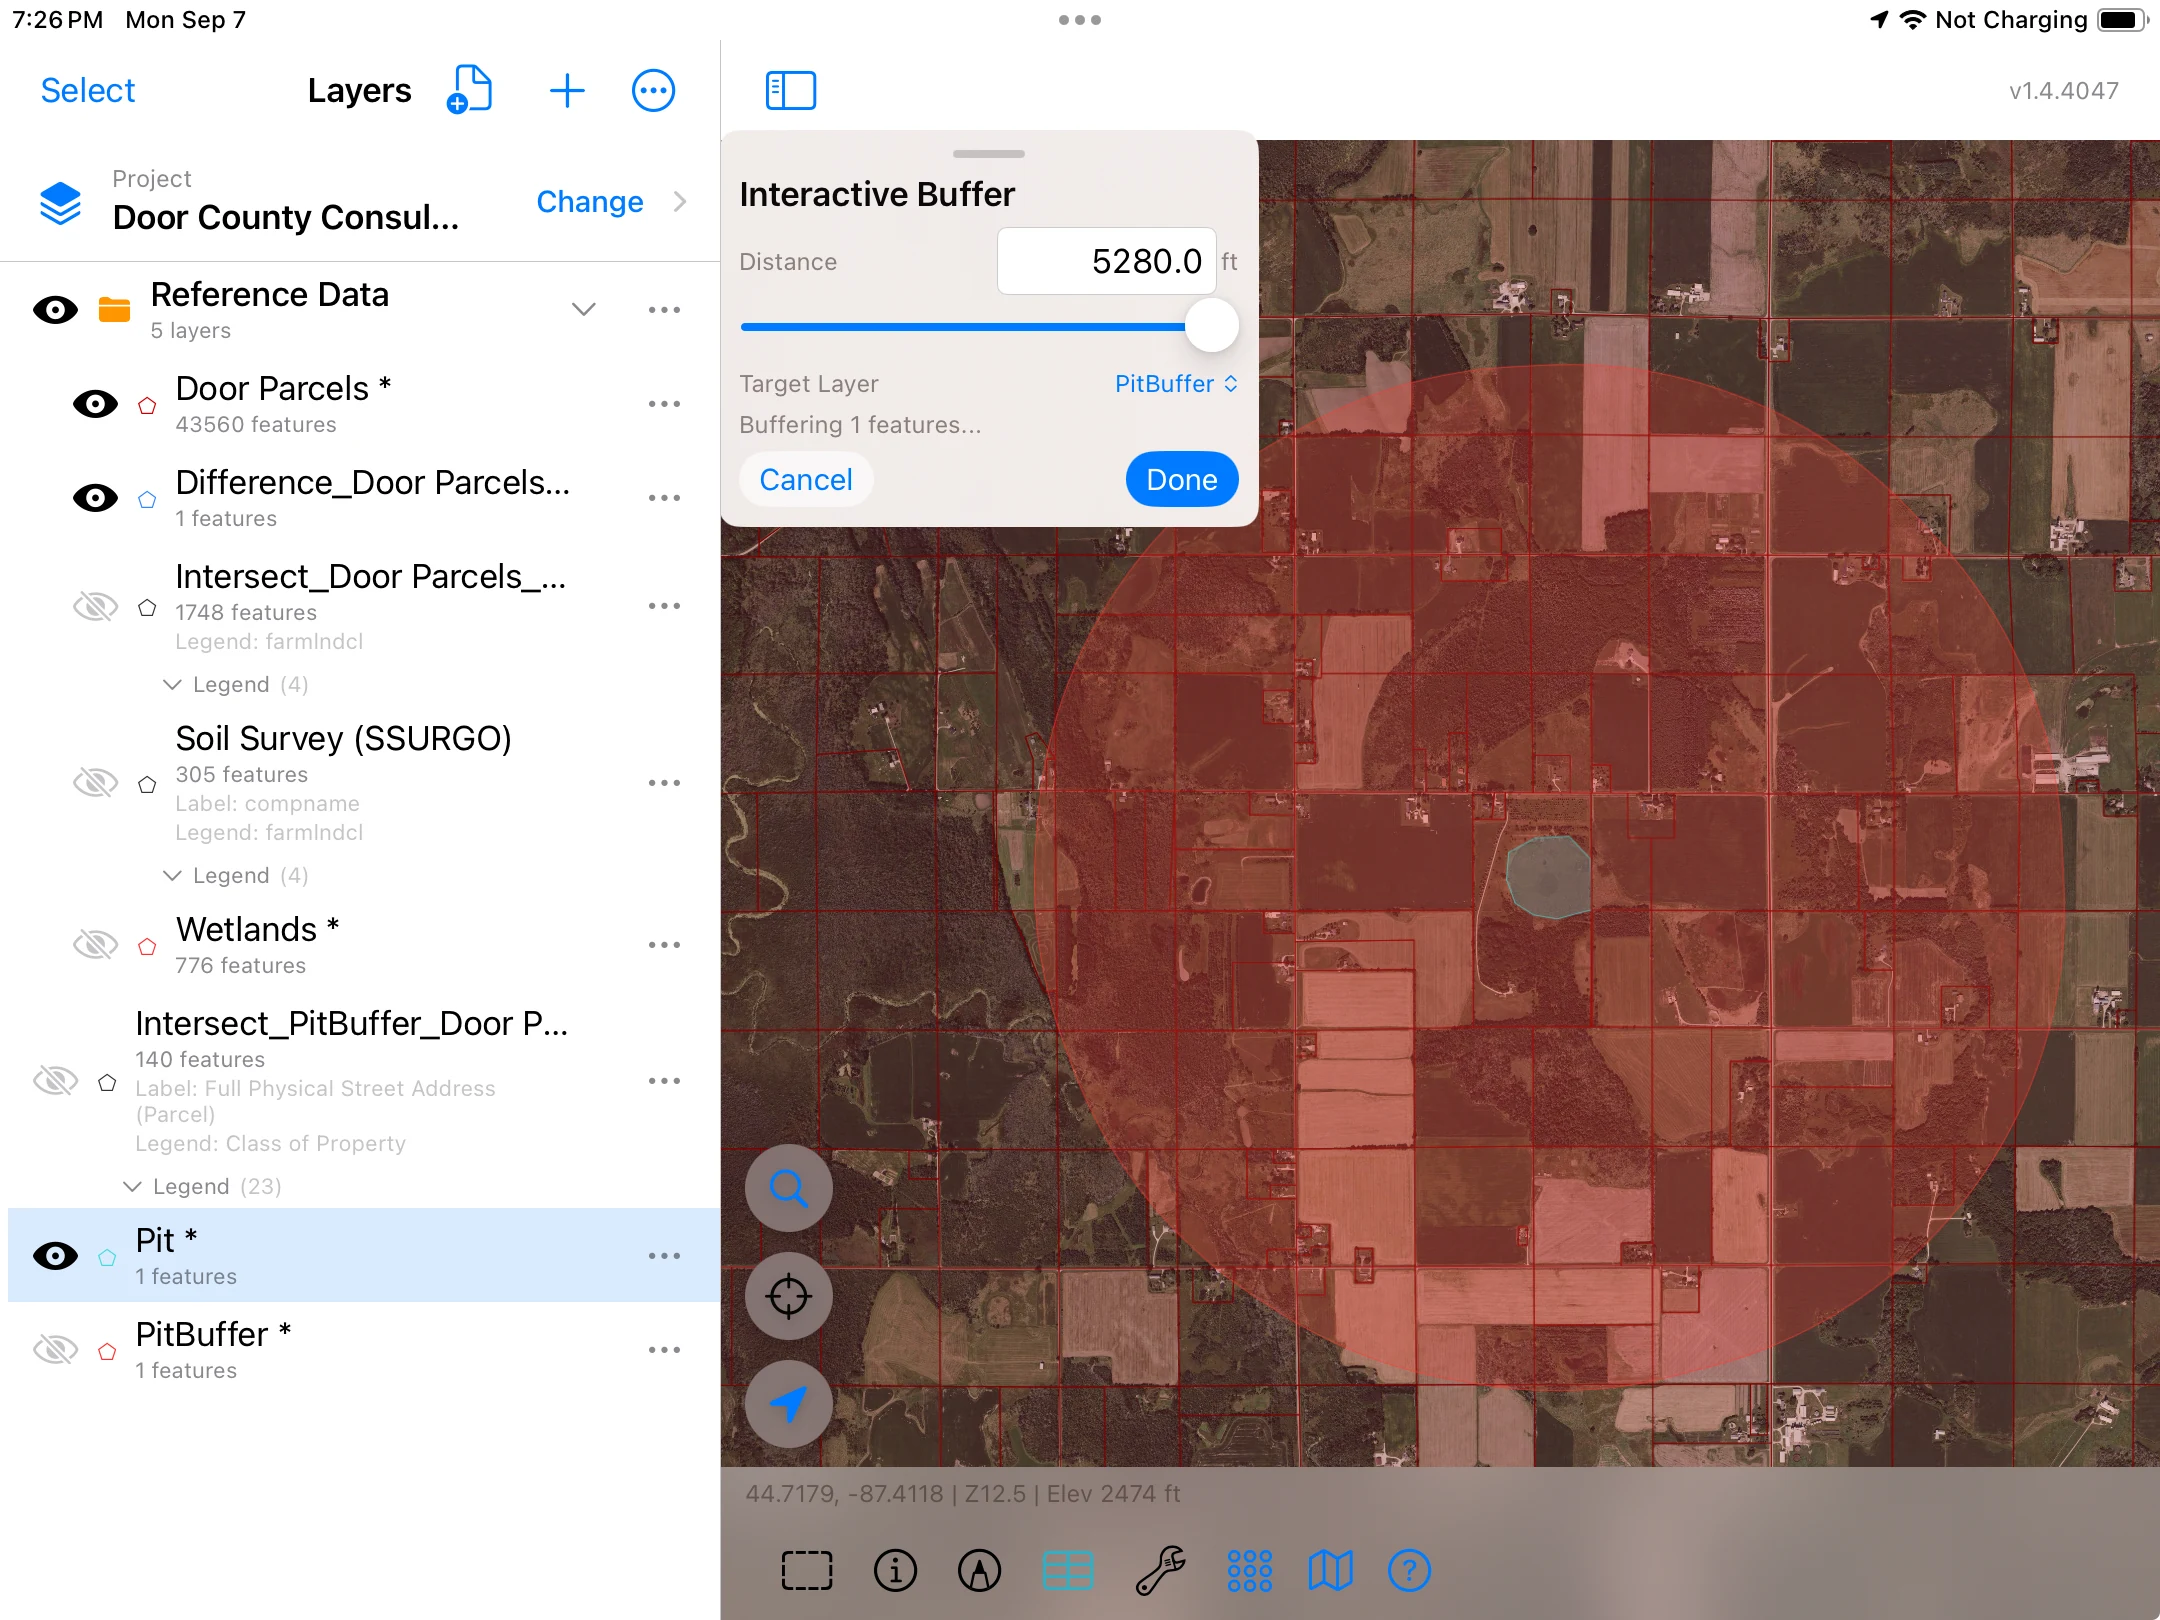
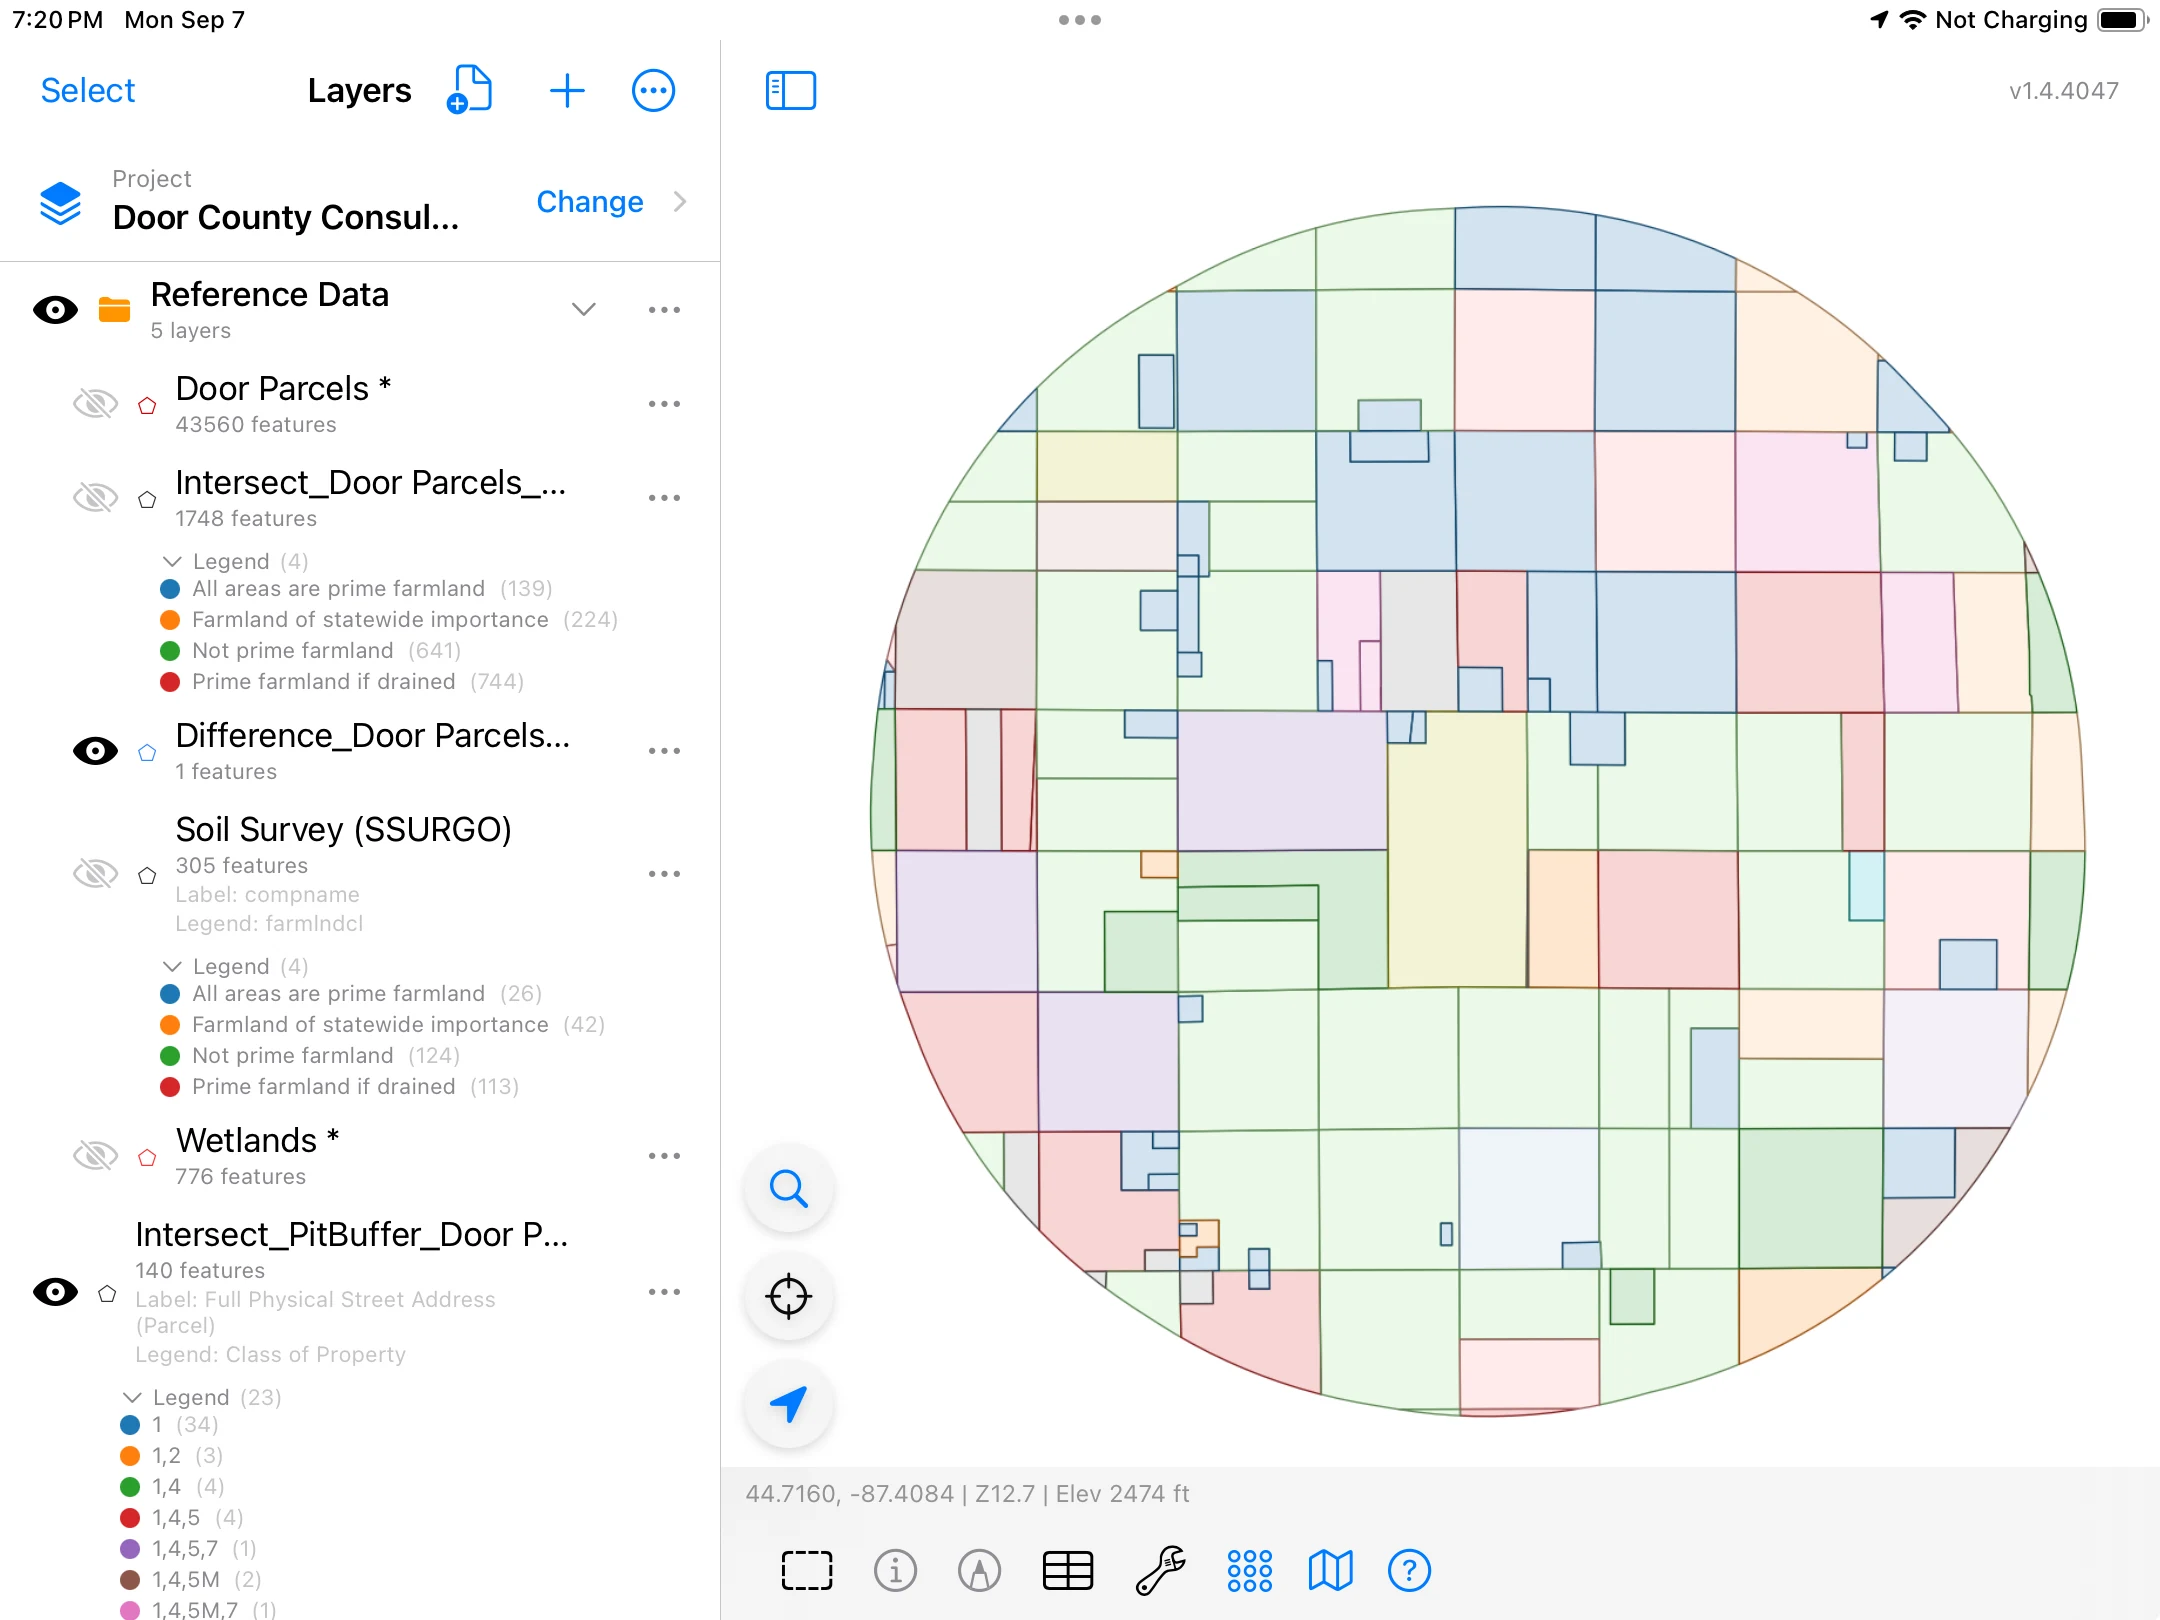
This example produces 140 output features. Review addresses, parcel IDs, property classifications, and source attributes in the grid.
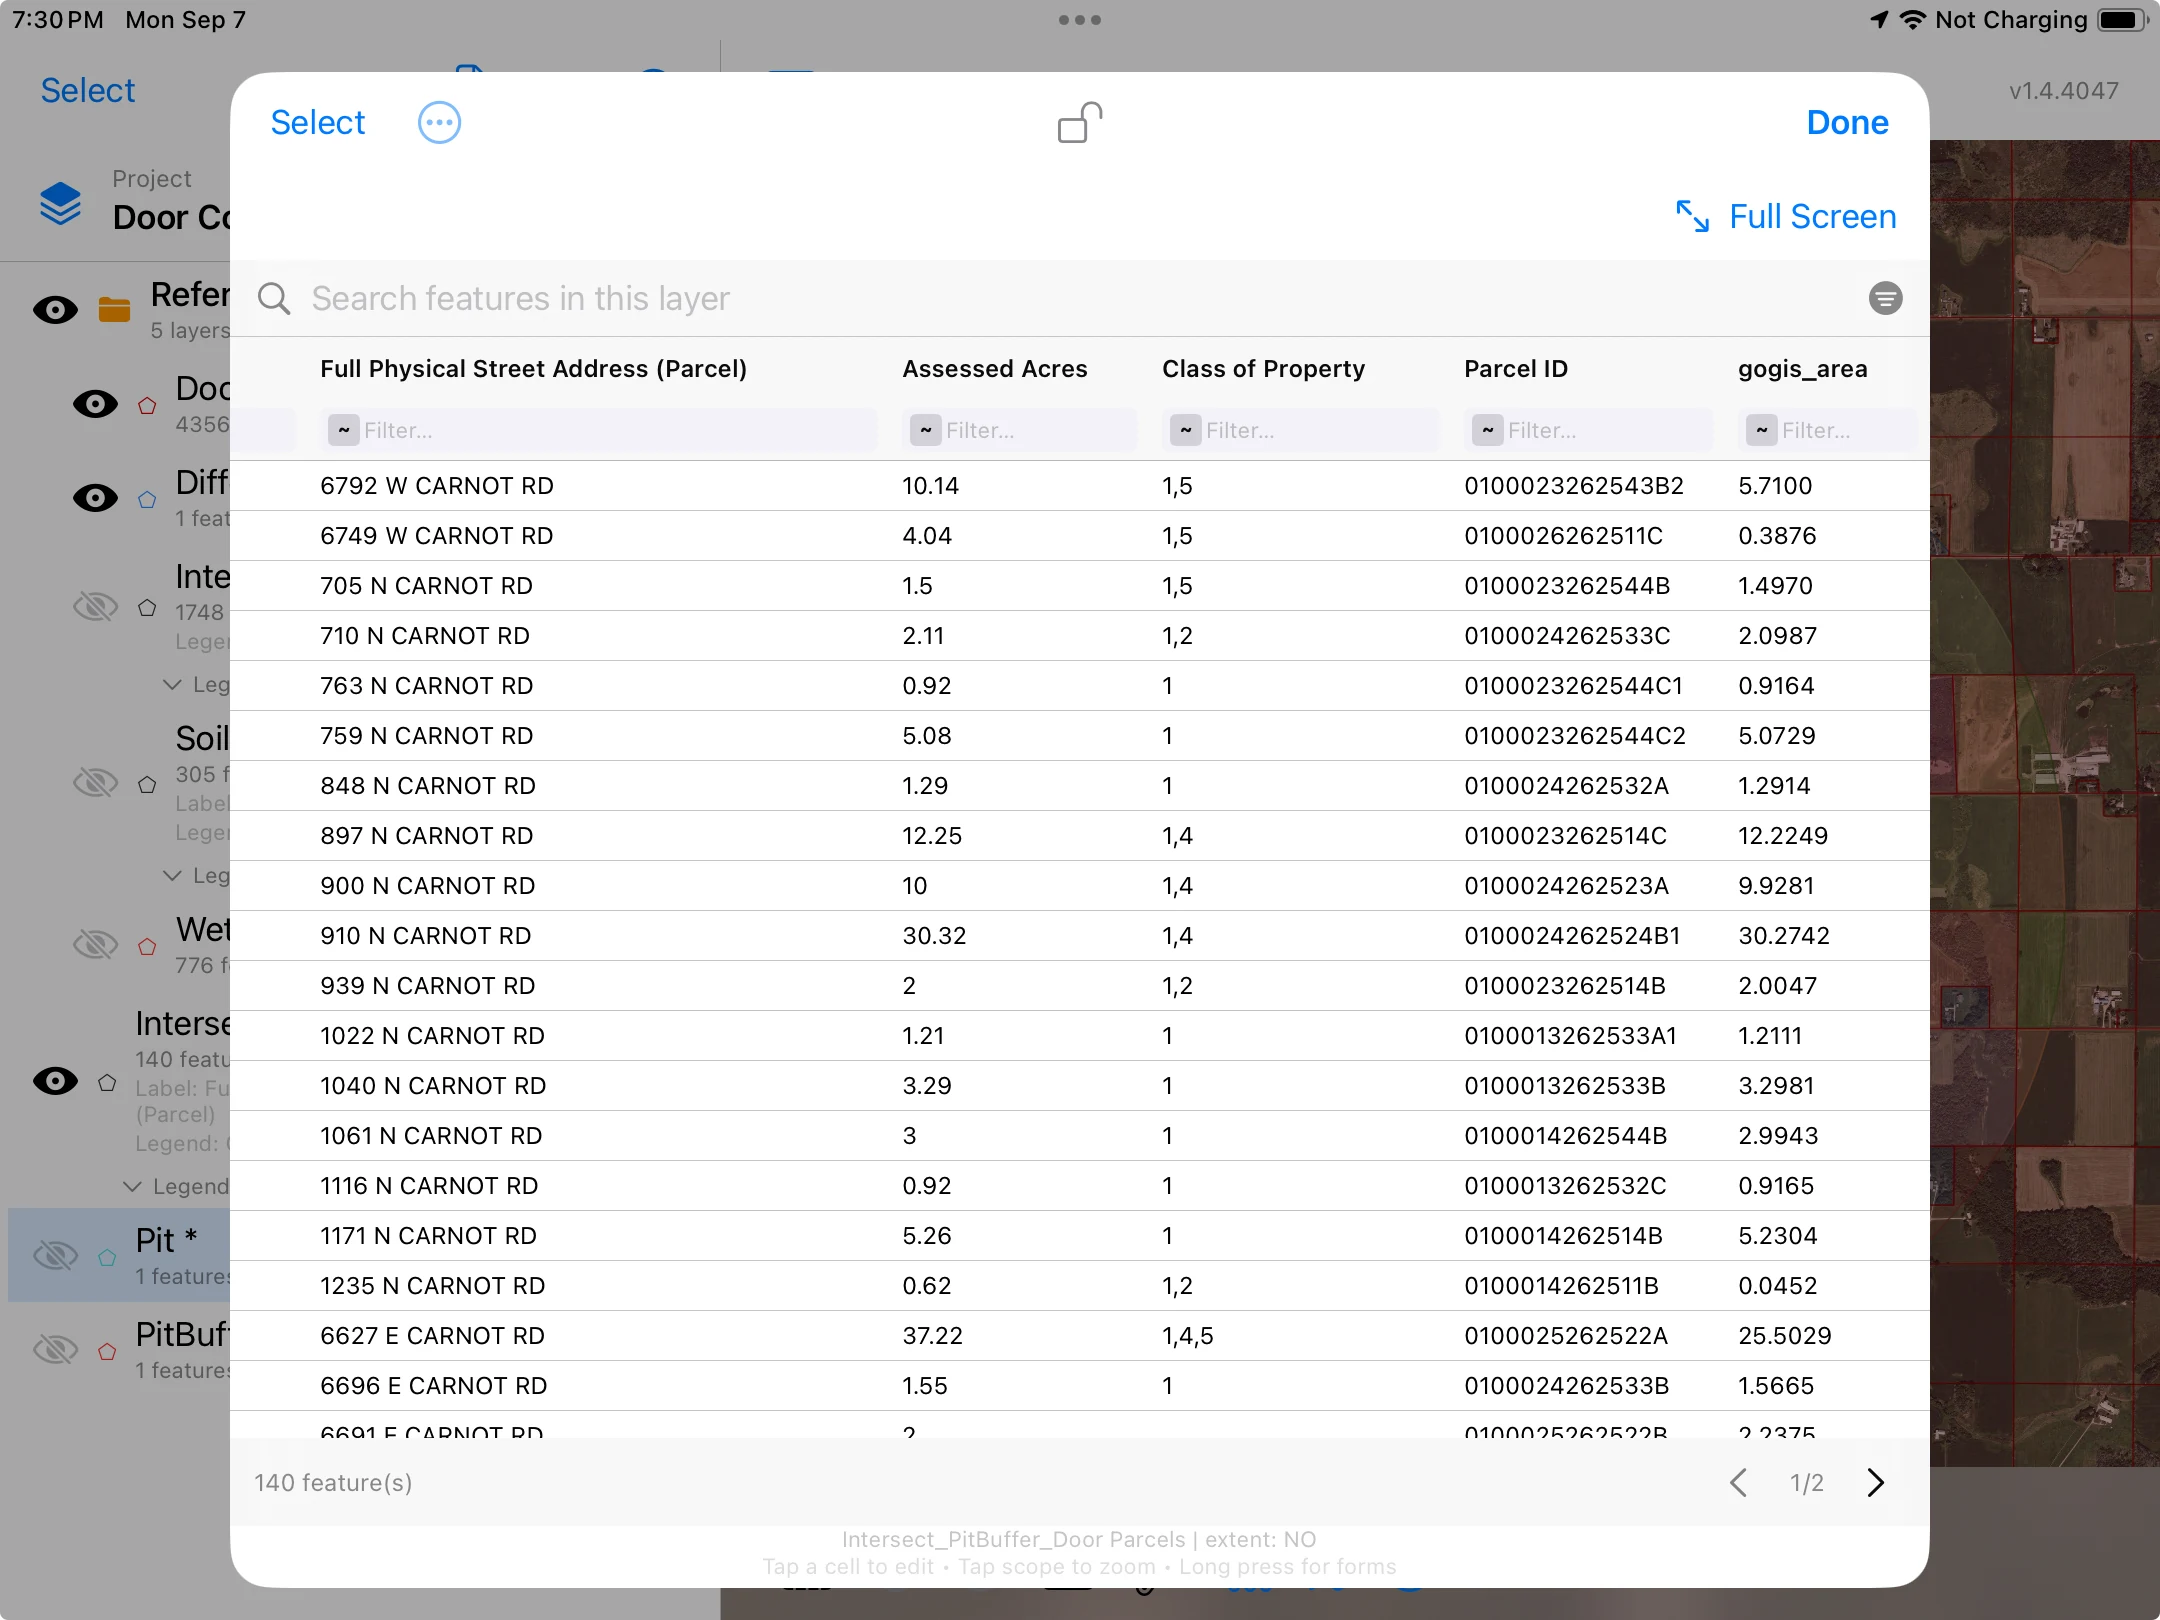
Illustrative proposed-site scenario. One mile is the chosen study distance. Assessed Acres is a source parcel attribute, separate from the calculated area of each intersection result.
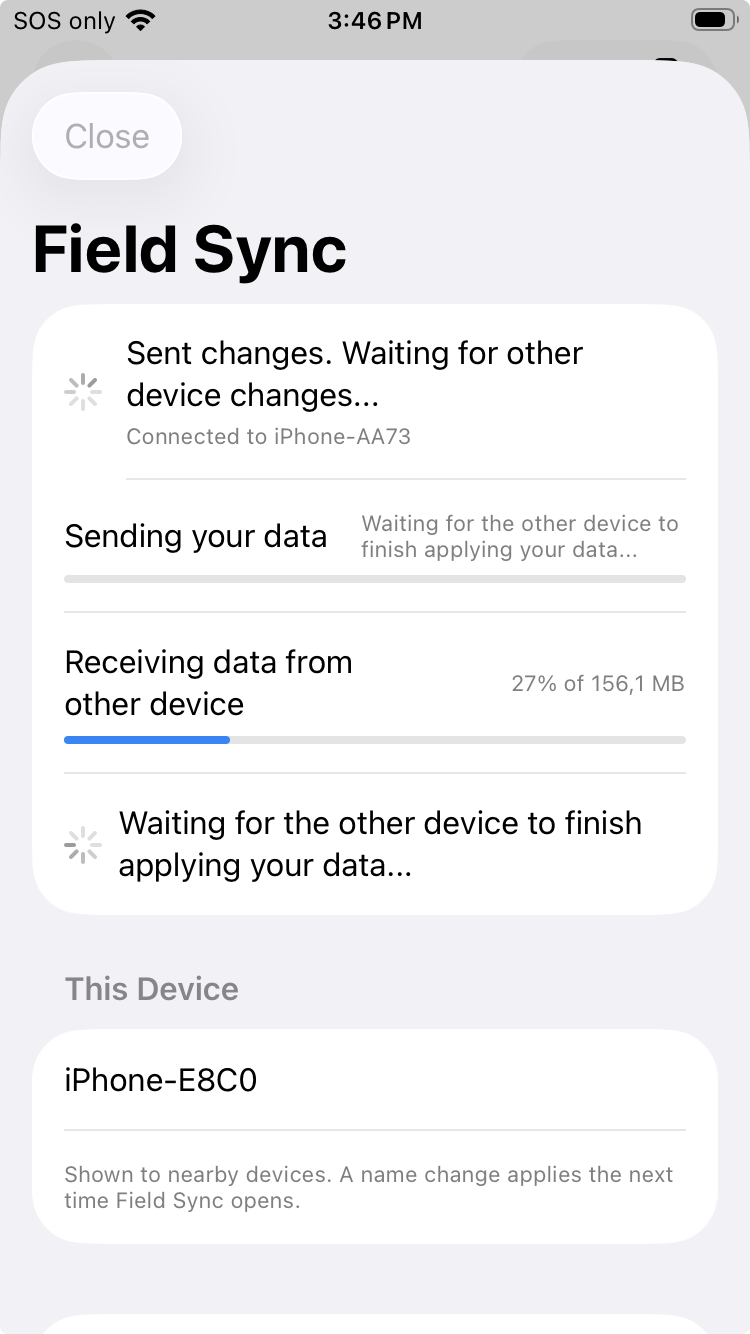
Use Field Sync to exchange project changes between nearby Apple and Android devices over a local connection, without a cloud account.
Transfer feature records, related forms and photographs so the work is available on the device you need next.
How Field Sync works →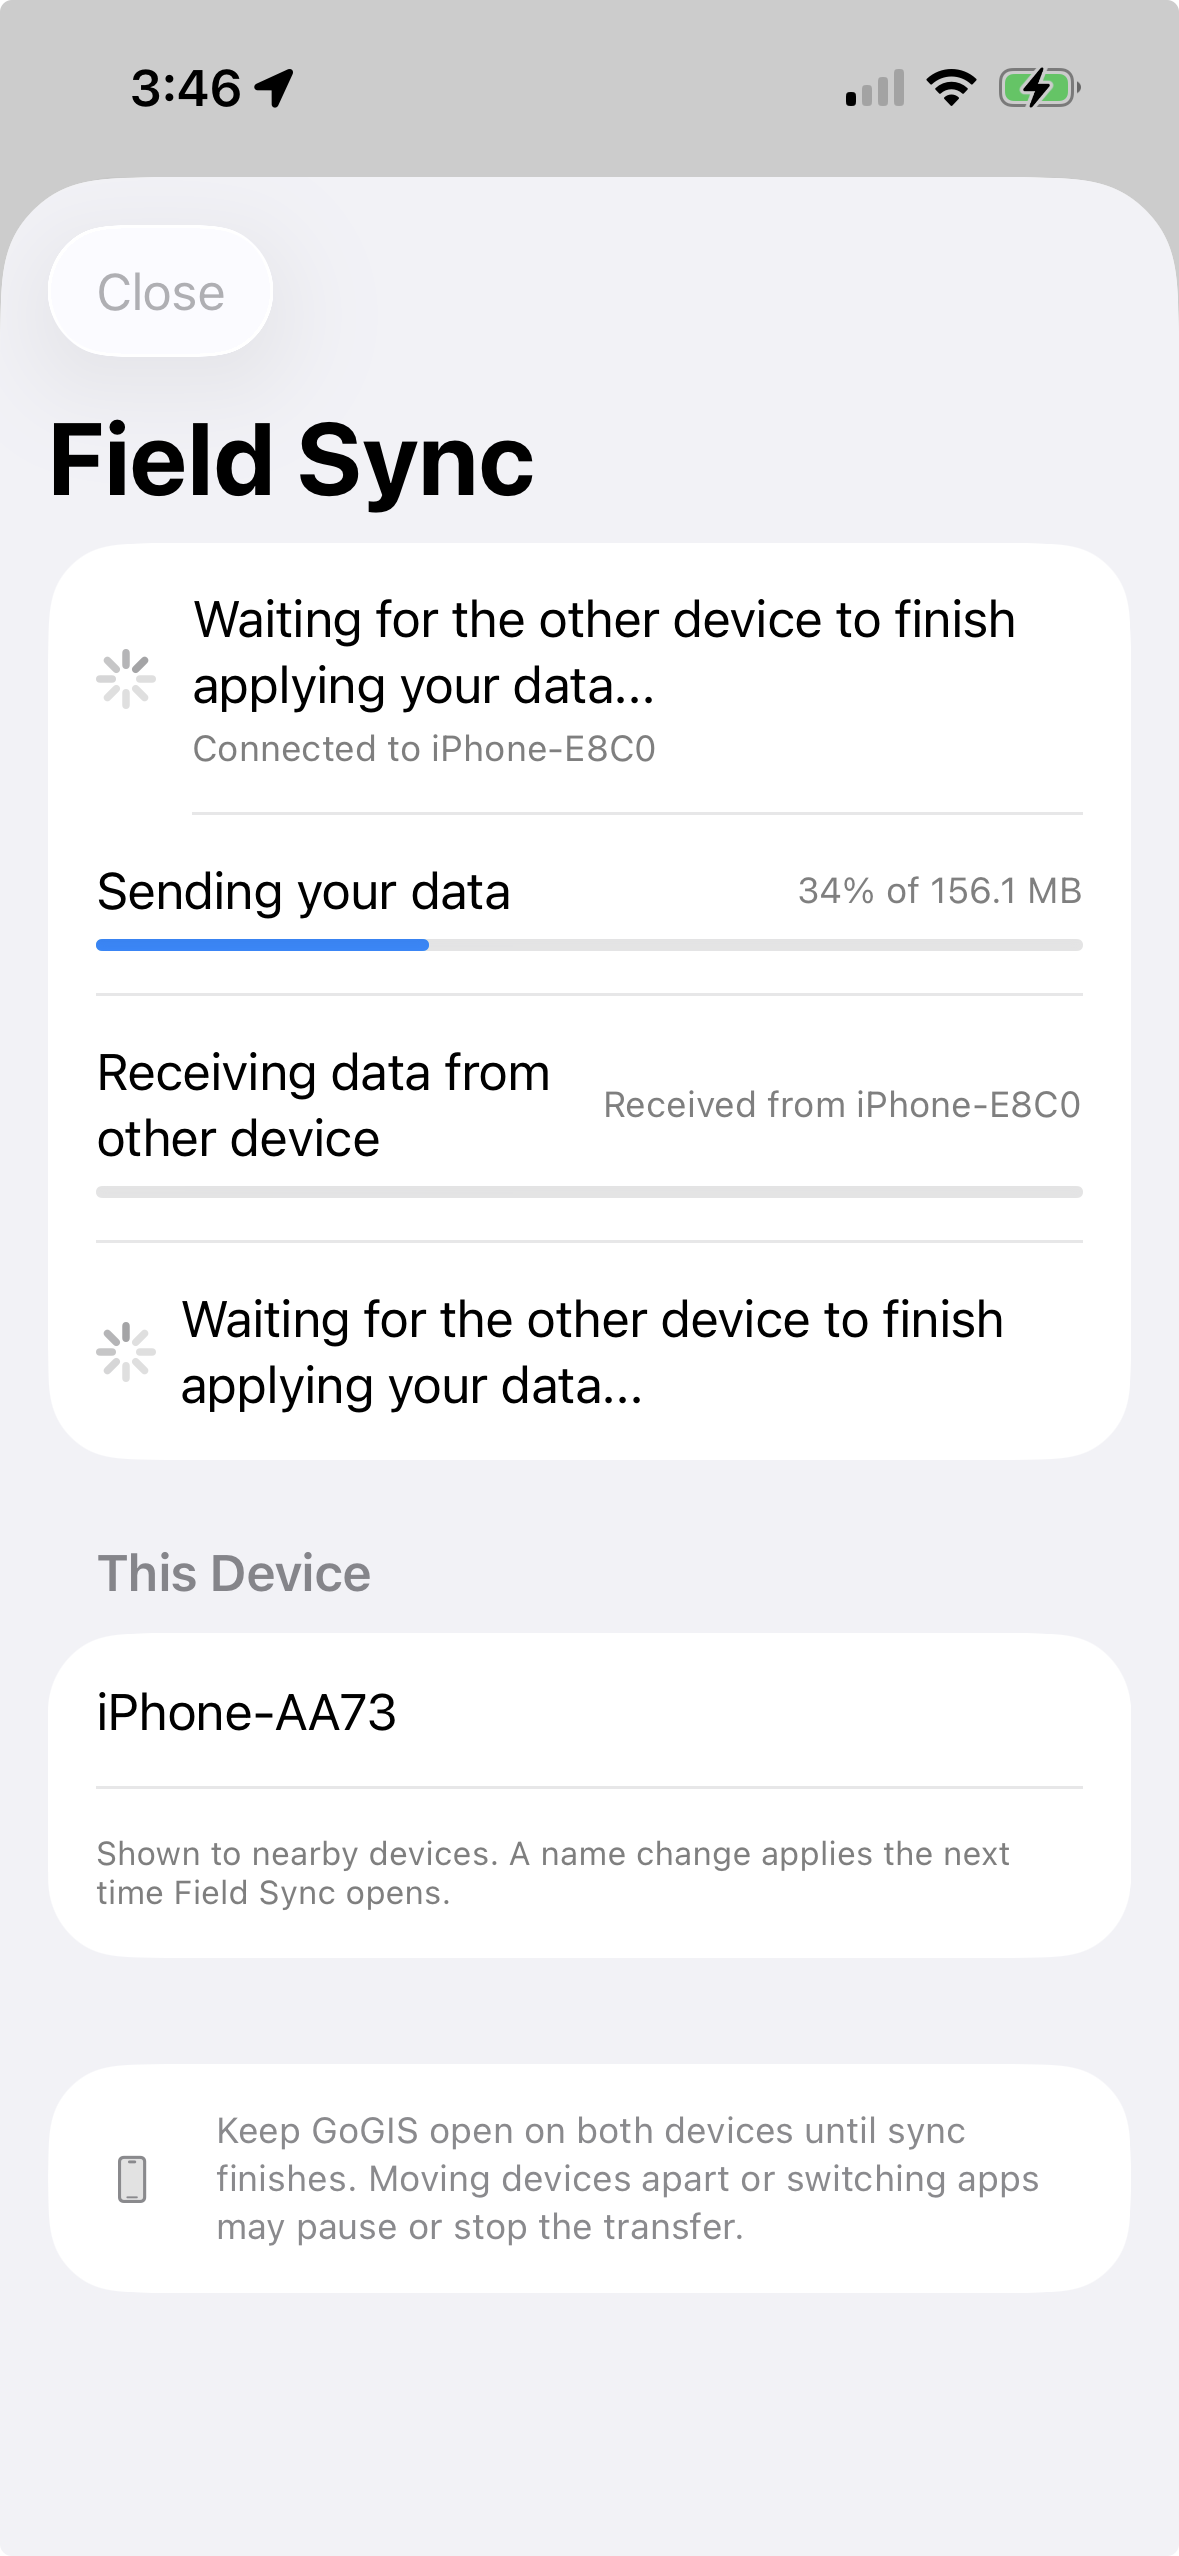
Imported vector data remains available without a connection. For an offline basemap, download supported USGS sources in the United States or GSI sources in Japan before you leave coverage. Built-in basemap downloads are currently limited to those regions.


Export GIS files for further analysis, create a PDF map, or share related records as CSVs linked to their source features. The same tools support a sampling program, an inspection history, or a map you need to review.
How exported records stay linked →Start with the files you already have. Bring the results back into the tools you use.
Start with your own data →Import Shapefile, GeoPackage, KML/KMZ, GeoJSON, and CSV. Add GeoTIFF or MBTiles imagery. GoGIS supports projected shapefiles through their accompanying coordinate-system information.
Export Shapefile, GeoPackage, GeoJSON, KML, or CSV. Related-form CSVs link back to the parent features.
Work with imported vector data, collect records, and run geometry operations on the device. Built-in basemap downloads are available for supported USGS sources in the United States and GSI sources in Japan. Save the area you need before leaving coverage. Elsewhere, imported vector data remains available offline, but GoGIS does not currently provide built-in basemap downloads. Downloads and online services require a connection.
Prepare for offline work →GoGIS runs on iPhone, iPad, supported Macs, and Android phones and tablets. Move projects between platforms or use Field Sync to exchange changes between nearby devices over a local connection.
External Bad Elf receiver support is currently available on iPhone and iPad. Check platform-specific requirements for specialist hardware.
Read about Field Sync →Yes. Import a file to view its features and attributes. Add collection, editing, and analysis to the project as you need them.
Open a shapefile on iPhone →Bring your data into the field, work with it on location, and take the results with you.
No subscription. No account required.

A Wisconsin statewide parcel map for your phone. Download counties, search public records, and keep field photos and notes on your device.